
Stream Oracle changes to ClickHouse in real time with Redpanda Connect
A hands-on walkthrough of our new Oracle CDC connector
Learn how to ingest website clickstream data into Redpanda and process them to uncover real-time insights with Decodable.


Clickstream data is a record of user interactions with a website or a complete journey through multiple websites. It can be used to understand how users are interacting with a website and to identify trends and patterns in their behavior. For example, you might want to know how many users are visiting your website, how long they stay on each page, and what pages they visit. You can use this information to improve your website and make it more engaging for users.
You can learn a lot about your users and their behavior by analyzing clickstream data. If you are able to access this data in real-time, you can even identify trends and patterns as they are happening, and take action to improve your website before it is too late.
As usual, the complete version of the code examples present in the article are available on GitHub.
Redpanda is a Kafka-compatible streaming data platform that makes it easy to build real-time applications. It is a great tool for collecting and analyzing clickstream data, and combined with Decodable, it can be used to build a complete data pipeline that can be used to analyze clickstream data in real-time.
Setting up a Redpanda cluster for development and connecting it to Decodable can be done in a few minutes. In this article, we will show you how to do this, and how to use Decodable to build a data pipeline that can be used to analyze clickstream data in real-time.
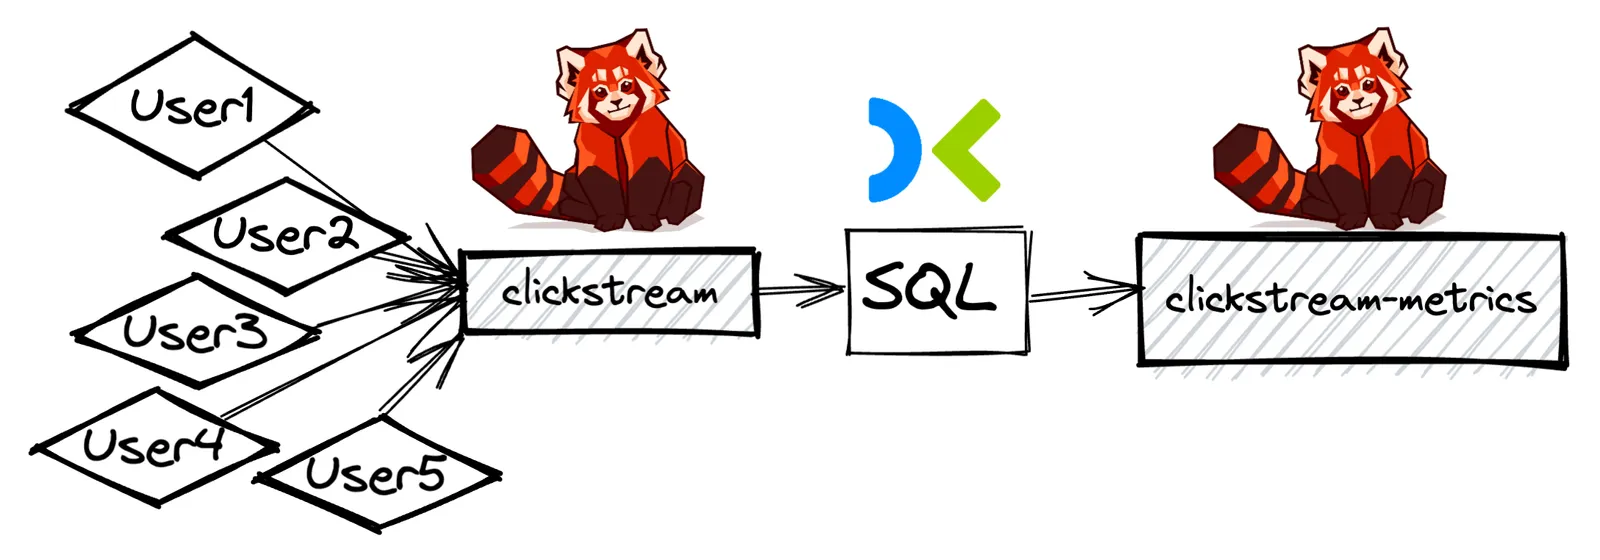
This is the high-level architecture of the data pipeline we will build in this article. It consists of a Redpanda cluster running locally and a serverless Decodable pipeline that is connected to the cluster. We will mock the clickstream data by generating random data using a Python script, publishingit to a Redpanda topic called clickstream using a simple producer, and we will use Decodable to analyze the data and store the results in a different Redpanda topic, called clickstream-metrics.
First, let's take a look at the data we will be using in this article. A single click event in the clickstream will have the following format:
    {
  "timestamp": "2020-11-16 22:59:59",
  "event": "view_item",
  "user_id": "user1",
  "site_id": "wj32-gao1-4w1o-iqp4",
  "url": "https://www.example.com/item/1",
  "on_site_seconds": 55,
  "viewed_percent": 30
}
A short explanation of the fields:
The timestamp field contains the timestamp of the event, the event field contains the type of event, the user_id field contains the ID of the user who triggered the event, the site_id field contains the ID of the website where the event occurred, the url field contains the URL of the page where the event occurred, the on_site_seconds field contains the number of seconds the user spent on the page, and the viewed_percent field contains the percentage of the page that the user viewed.
This schema is fairly close to the actual clickstream data that you could collect from tools such as Google Analytics or Snowplow, although it is simplified for the purposes of this article.
The Python function we will use to generate the data will generate a random value for each field, and it will also add a random delay between each event. This will simulate a real-world scenario where the events are generated at different times and in different orders.
The following function contains the logic to generate clickstream data for a given user_id and publish to the clickstream topic.
async def generate_clickstream_data_for_user(user_id):
    producer = KafkaProducer(bootstrap_servers=BOOTSTRAP_SERVERS)
    while True:
        data = {
            "timestamp": datetime.now().strftime("%Y-%m-%d %H:%M:%S"),
            "event": random.choice(CLICKSTREAM_EVENTS),
            "user_id": user_id,
            "site_id": f"{random.choice(['amazing-store', 'horrible-store', 'meh-store'])}.com",
            "url": random.choice([f"/item/{i}" for i in range(10)]),
            "on_site_seconds": random.randint(0, 100),
            "viewed_percent": random.randint(0, 100),
        }
        producer.send(
            CLICKSTREAM_TOPIC,
            key=user_id.encode("utf-8"),
            value=json.dumps(data).encode("utf-8"),
        )
        print(f"Sent clickstream event data to Redpanda: {data}, sleeping for 3 seconds")
        await asyncio.sleep(random.randint(1, 5))
For the full code, see the Github repository.
To test our script, we can quickly run it using the following command:
python clickstream_data_generator.py
The output should look something like this:
Sent clickstream event data to Redpanda: {'timestamp': '2020-11-16 23:05:01', 'event': 'view_item', 'user_id': 'user1', 'site_id': 'horrible-store.com', 'url': '/item/8', 'on_site_seconds': 4, 'viewed_percent': 3}, sleeping for 1 seconds
Sent clickstream event data to Redpanda: {'timestamp': '2020-11-16 23:05:02', 'event': 'add_to_cart', 'user_id': 'user3', 'site_id': 'horrible-store.com', 'url': '/item/5', 'on_site_seconds': 50, 'viewed_percent': 90}, sleeping for 3 seconds
Sent clickstream event data to Redpanda: {'timestamp': '2020-11-16 23:05:03', 'event': 'logout', 'user_id': 'user5', 'site_id': 'amazing-store.com', 'url': '/item/9', 'on_site_seconds': 55, 'viewed_percent': 60}, sleeping for 5 seconds
Sent clickstream event data to Redpanda: {'timestamp': '2020-11-16 23:05:04', 'event': 'view_cart', 'user_id': 'user1', 'site_id': 'meh-store.com', 'url': '/item/8', 'on_site_seconds': 3, 'viewed_percent': 40}, sleeping for 2 seconds
But wait, instead, our output will probably look something like this:
kafka.errors.NoBrokersAvailable: NoBrokersAvailable
This is because we need to start a Redpanda cluster first!
To set up a local Redpanda cluster for development, we can use the rpk tool. rpk is a command-line tool that can be used to easily manage local Redpanda clusters. It can be used to start, stop, and manage Redpanda clusters, and it can also be used to create topics, produce and consume messages, and more. For a detailed list of all the commands that can be used with rpk, see the documentation.
To start our local Redpanda cluster, we can use the following command:
rpk container start -n 1
This will start a single-node Redpanda cluster. The output should look something like this:
Waiting for the cluster to be ready...
  NODE ID  ADDRESS
  0        127.0.0.1:54920

Cluster started! You may use rpk to interact with it. E.g:

  rpk cluster info --brokers 127.0.0.1:54920

You may also set an environment variable with the comma-separated list of broker addresses:

  export REDPANDA_BROKERS="127.0.0.1:54920"
  rpk cluster info
Now if we follow the instructions and run the following command:
export REDPANDA_BROKERS="127.0.0.1:54920"
And then run our Python script again, we should see the output we expected:
Sent clickstream event data to Redpanda: {'timestamp': '2020-11-16 23:05:01', 'event': 'view_item', 'user_id': 'user1', 'site_id': 'horrible-store.com', 'url': '/item/8', 'on_site_seconds': 4, 'viewed_percent': 3}, sleeping for 1 seconds
Sent clickstream event data to Redpanda: {'timestamp': '2020-11-16 23:05:02', 'event': 'add_to_cart', 'user_id': 'user3', 'site_id': 'horrible-store.com', 'url': '/item/5', 'on_site_seconds': 50, 'viewed_percent': 90}, sleeping for 3 seconds
Sent clickstream event data to Redpanda: {'timestamp': '2020-11-16 23:05:03', 'event': 'logout', 'user_id': 'user5', 'site_id': 'amazing-store.com', 'url': '/item/9', 'on_site_seconds': 55, 'viewed_percent': 60}, sleeping for 5 seconds
Great! For easier reproducibility, let's take a look at how we can Dockerize our producer script and Redpanda.
To Dockerize our Redpanda cluster, we will use Docker Compose. If you don't have Docker Compose installed, you can find the installation instructions here. Once you have Docker Compose installed, you can create a file called docker-compose.yml with the following contents:
version: '3.7'
services:
  producer:
    build: ./producer
    container_name: producer
  redpanda:
    image: docker.vectorized.io/vectorized/redpanda:v22.2.7
    container_name: redpanda
    command:
      - redpanda start
      - --overprovisioned
      - --smp 1
      - --memory 1G
      - --reserve-memory 0M
      - --node-id 0
      - --check=false
      - --kafka-addr PLAINTEXT://0.0.0.0:29092,OUTSIDE://0.0.0.0:9092
      - --advertise-kafka-addr PLAINTEXT://redpanda:29092,OUTSIDE://localhost:9092
      - --pandaproxy-addr 0.0.0.0:8082
      - --advertise-pandaproxy-addr redpanda:8082
      - --set redpanda.enable_transactions=true
      - --set redpanda.enable_idempotence=true
      - --set redpanda.auto_create_topics_enabled=true
    ports:
      - "9092:9092"
      - "8081:8081"
      - "8082:8082"
      - "9644:9644"
Now we can start our Redpanda cluster and producer at the same time by running the following command:
docker-compose updocker-compose up
After a few seconds, both services should start running. If you see a similar output as above from the Producer service, it means that it is successfully pushing messages into the clickstream topic in Redpanda.
Before we move on to defining our transformations with Decodable, let's make our local Redpanda cluster accessible from the Internet. For this, we will use ngrok. If you don't have ngrok installed, you can find the installation instructions here. You will have to register a free account and add your fresh authentication token via the ngrok config add-authtoken <token> command, as per the installation instructions.
Using ngrok, we are able to forward traffic from the internet to our local Redpanda cluster. To do this, we will run the following command:
ngrok tcp 9092
This will result in an output similar to this:
ngrok                                                                                                                                                        Visit http://localhost:4040/ to inspect, replay, and modify your requests

Session Status                online
Account                       danivgy@gmail.com (Plan: Free)
Version                       3.1.0
Region                        Europe (eu)
Latency                       -
Web Interface                 http://127.0.0.1:4040
Forwarding                    tcp://0.tcp.eu.ngrok.io:15250 -> localhost:9092

Connections                   ttl     opn     rt1     rt5     p50     p90
                              0       0       0.00    0.00    0.00    0.00
In the forwarding section, you can see the URL that we will use to connect to our local Redpanda cluster from the Internet. In this case, it is tcp://0.tcp.eu.ngrok.io:15250. We need to add this address as the advertised address of our Redpanda cluster, so Decodable will be able to connect to our Redpanda nodes.
To do this, edit the following line in the docker-compose.yml file:
--advertise-kafka-addr PLAINTEXT://redpanda:29092,OUTSIDE://localhost:9092
to:
--advertise-kafka-addr PLAINTEXT://redpanda:29092,OUTSIDE://0.tcp.eu.ngrok.io:15250
In short, what is happening here is that whenever a service connects to our cluster from outside on the 9092 port, it will get back the ngrok address as the advertised address. This way, Decodable will be able to connect to our Redpanda cluster from the internet.
Now we can restart our Redpanda cluster by running the following command:
docker-compose down && docker-compose up
Now that our Redpanda cluster is accessible from the internet, we can move on to defining our transformations with Decodable.
Decodable is a fully managed data platform that allows you to define transformations in SQL and deploy them in minutes to be used in real-time applications. It provides a simple CLI interface along with a well-documented REST API and a clean UI to manage your connections and transformations. For our example, we will use the Decodable CLI.
The first step is registering for a free account on Decodable. Once you have registered, you can install the Decodable CLI by running the following command:
curl -s https://decodable.com/install.sh | bash
To set up your local Decodable environment and connect to your Decodable account, consult the instructions here. After you have set up your local Decodable environment, in the next steps we will create a connection to our Redpanda clusters and all the other resources required for our pipeline.
First of all the anatomy of a Decodable pipeline is as follows:
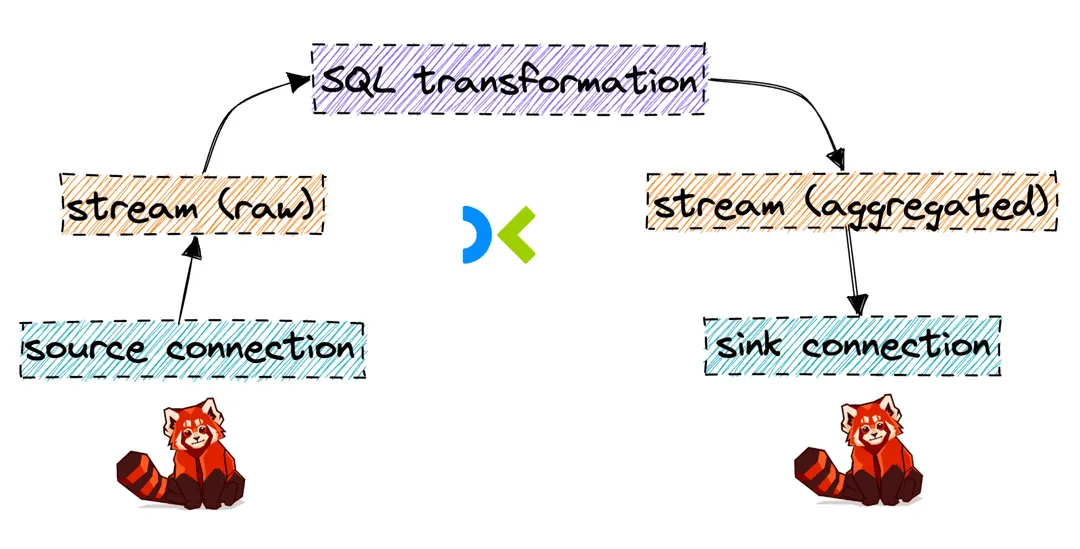
As you can see, our Decodable pipeline consists of source and sink connections, two streams, and one transformation. In our case, the source and sink connections will both point to our local Redpanda cluster, but Decodable supports a wide array of connectors. Streams are similar to topics in Redpanda, they are responsible for holding the data while it is being piped through Decodable. They can be read from and written to by the transformations. Finally, transformations are the heart of Decodable, they are where you define your SQL queries for the processing.
Our transformation will be a windowed aggregation query that will group the data by the user_id field and count the number of clicks per user for each URL for the previous 5 minutes. The result will be written to a new topic called clickstream_aggregated.
First, let's create our two streams that will hold the data while it is being processed.
To create the first stream, which will hold the raw clickstream data, run the following command:
decodable stream create --name clickstream \
    --field timestamp="TIMESTAMP(3)" \
    --field event=STRING \
    --field user_id=STRING \
    --field site_id=STRING \
    --field url=STRING \
    --field on_site_seconds=INT \
    --field viewed_percent=INT \
    --watermark "\`timestamp\` AS \`timestamp\` - INTERVAL '0.001' SECOND"
We only define three important attributes:
clickstream)To verify that the stream was created successfully, run the following command:
decodable stream list
You should see an output similar to this:
id         name                     create time                   update time
b88b7819   clickstream              2022-10-29T11:45:07Z          2022-10-29T11:45:07Z
Our second stream will hold the aggregated data. To create it, run the following command:
decodable stream create --name clickstream_aggregated \
    --field window_start=TIMESTAMP \
    --field window_end=TIMESTAMP \
    --field user_id=STRING \
    --field event=STRING \
    --field url=STRING \
    --field event_count=INT
Again, let's verify that the stream was created successfully:
❯ decodable stream list
This time, you should see two streams in the output:
id         name                     create time                   update time
b88b7819   clickstream              2022-10-29T11:45:07Z          2022-10-29T11:45:07Z
c38b2352   clickstream_aggregated   2022-10-29T11:45:07Z          2022-10-29T11:45:07Z
After the two streams are created, we can move on to creating our source and sink connections.
To create the source connection, run the following command:
decodable connection create \
  --connector redpanda \
  --name redpanda-local-source \
  --description "Source connector for local Redpanda cluster" \
  --stream-id 062fa829 \   # stream id from previous step, where we created the clickstream stream
  --type source \
  --prop bootstrap.servers=5.tcp.eu.ngrok.io:16656 \
  --prop value.format=json \
  --prop topic=clickstream
Let's unpack the command a bit:
redpanda connector.redpanda-local-source.clickstream stream using the stream-id that we created in the previous step.bootstrap.servers property to the ngrok address that we set in the Redpanda configuration.value.format property to json since we know that our data is in JSON format.topic property to clickstream since that is the topic that we are reading from.type property to source since this is a source connection.Whew! That was a lot of information. Let's verify that the connection was created successfully:
❯ decodable connection list
id         name                     connector    type         create time                   update time
3dada5e6   redpanda-local-source    redpanda     source       2022-10-29T11:44:43Z          2022-10-29T11:44:43Z
Using the id we can grab the details of the connection:
❯ decodable connection get 3dada5e6

redpanda-local-source
  id                       3dada5e6
  description              Source connector for local Redpanda cluster
  connector                redpanda
  type                     source
  stream id                be2d7d03
  schema
    0  timestamp           TIME(0)
    1  event               STRING
    2  user_id             STRING
    3  site_id             STRING
    4  url                 STRING
    5  on_site_seconds     INT
    6  viewed_percent      INT
  properties
    bootstrap.servers      0.tcp.eu.ngrok.io:15250
    topic                  clickstream
    value.format           json
  target state             STOPPED
  actual state             STOPPED
  requested tasks          1
  actual tasks             0
  create time              2022-10-29T11:44:43Z
  update time              2022-10-29T11:44:43Z
  last runtime error       <none>
  metrics
As we can see, it's currently in the STOPPED state, which means that it is not currently running. We can start it by running the following command:
decodable connection activate 3dada5e6
In the output, we can see that the connection is now in the STARTING state, and the target state will switch to RUNNING:
  target state             RUNNING
  actual state             STARTING
After a few seconds, if we check the details again, the connection will be in the RUNNING state, if everything went well:
  target state             RUNNING
  actual state             RUNNING
Now that we have our source connection running, we can create our sink connection. To create the sink connection, run the following command:
decodable connection create \
  --connector redpanda \
  --name redpanda-local-sink \
  --description "Sink connector for local Redpanda cluster" \
  --stream-id 7fd1d4ca \   # stream id from previous step, where we created the clickstream_aggregated stream
  --type sink \
  --prop bootstrap.servers=5.tcp.eu.ngrok.io:16656 \
  --prop value.format=json \
  --prop topic=clickstream_aggregated
The command is very similar to the one we used to create the source connection, with a few differences:
clickstream_aggregated stream using the stream-id that we created in the previous step.type property to sink since this is a sink connection.topic property to clickstream_aggregated since that is the topic that we are writing to.We can activate and verify the connection in the same way as we did for the source connection:
decodable connection activate 3dada5e6
❯ decodable connection get 3dada5e6
  target state             RUNNING
  actual state             RUNNING
Now that we have our source and sink connections running, we can move on to creating our query.
The query itself looks like this:
insert into clickstream_aggregated
select window_start,
       window_end,
       user_id,
       event,
       count(1) as event_count
from table (
    hop(
        table clickstream, descriptor(`timestamp`),
                           interval '10' seconds, -- Slide every 10 seconds
                           interval '5' minutes -- Look at 5 minutes
        )
    )
group by window_start, window_end, user_id, event
Let's unpack the query a bit: We first specify the target stream, clickstream_aggregated, where we want to insert the results of the query.
Then we specify the select clause, which is where we define the columns that we want to select. For the windowed aggregation, we are using a hopping (or sliding) window of 5 minutes, with a sliding interval of 10 seconds. This means that we will be aggregating the data in 5-minute windows, and sliding the window every 10 seconds.
For more information about how windowing works in Decodable, check out the official documentation.
To quickly verify that the query is correct, we can check some preliminary results without actually deploying it using the Decodable CLI:
❯ decodable pipeline preview "select window_start, window_end, user_id, event, url, count(1) AS event_count
from table ( hop( table clickstream, descriptor(\`timestamp\`), interval '10' seconds, interval '5' minutes ) )
group by window_start, window_end, user_id, event, url"

Submitting query... done! (took 5.60s)
Waiting for results...
{"after":{"event":"login","event_count":1,"url":"/item/3","user_id":"user_0","window_end":"2022-10-30 19:24:10","window_start":"2022-10-30 19:19:10"},"before":null,"op":"c"}
{"after":{"event":"logout","event_count":1,"url":"/item/8","user_id":"user_5","window_end":"2022-10-30 19:24:10","window_start":"2022-10-30 19:19:10"},"before":null,"op":"c"}
{"after":{"event":"login","event_count":1,"url":"/item/5","user_id":"user_6","window_end":"2022-10-30 19:24:10","window_start":"2022-10-30 19:19:10"},"before":null,"op":"c"}
{"after":{"event":"view_item","event_count":1,"url":"/item/7","user_id":"user_1","window_end":"2022-10-30 19:24:10","window_start":"2022-10-30 19:19:10"},"before":null,"op":"c"}
{"after":{"event":"view_item","event_count":1,"url":"/item/4","user_id":"user_1","window_end":"2022-10-30 19:24:10","window_start":"2022-10-30 19:19:10"},"before":null,"op":"c"}
{"after":{"event":"view_item","event_count":1,"url":"/item/7","user_id":"user_2","window_end":"2022-10-30 19:24:10","window_start":"2022-10-30 19:19:10"},"before":null,"op":"c"}
{"after":{"event":"login","event_count":1,"url":"/item/7","user_id":"user_3","window_end":"2022-10-30 19:24:10","window_start":"2022-10-30 19:19:10"},"before":null,"op":"c"}
{"after":{"event":"view_item","event_count":1,"url":"/item/1","user_id":"user_7","window_end":"2022-10-30 19:24:10","window_start":"2022-10-30 19:19:10"},"before":null,"op":"c"}
{"after":{"event":"view_item","event_count":1,"url":"/item/4","user_id":"user_2","window_end":"2022-10-30 19:24:10","window_start":"2022-10-30 19:19:10"},"before":null,"op":"c"}
{"after":{"event":"remove_from_cart","event_count":1,"url":"/item/9","user_id":"user_5","window_end":"2022-10-30 19:24:10","window_start":"2022-10-30 19:19:10"},"before":null,"op":"c"}
Records received:      10
Time to first record:  30.31s
Total time:            30.31s
As we can see from the output, the query is working as expected, although our aggregation didn't provide a lot of useful groups from such few results. This means we can move on to deploying the transformation and see how it fares with more data!
❯ decodable pipeline create \
   --name "clickstream-aggregation" \
   --description "Aggregates clickstream events" \
   "insert into clickstream_aggregated
   select window_start,
          window_end,
          user_id,
          event,
          url,
          count(1) as event_count
   from table (
       hop(
           table clickstream, descriptor(\`timestamp\`),
                              interval '10' seconds,
                              interval '5' minutes
           )
       )
   group by window_start, window_end, user_id, event, url"
Now there are two things left to do:
Let's start with activating our pipeline first. To do so, first grab its id:
❯ decodable pipeline list
id         name                     create time
006982ac   clickstream-aggregation  2022-10-30T19:28:11Z
Then activate it:
❯ decodable pipeline activate
id version target state
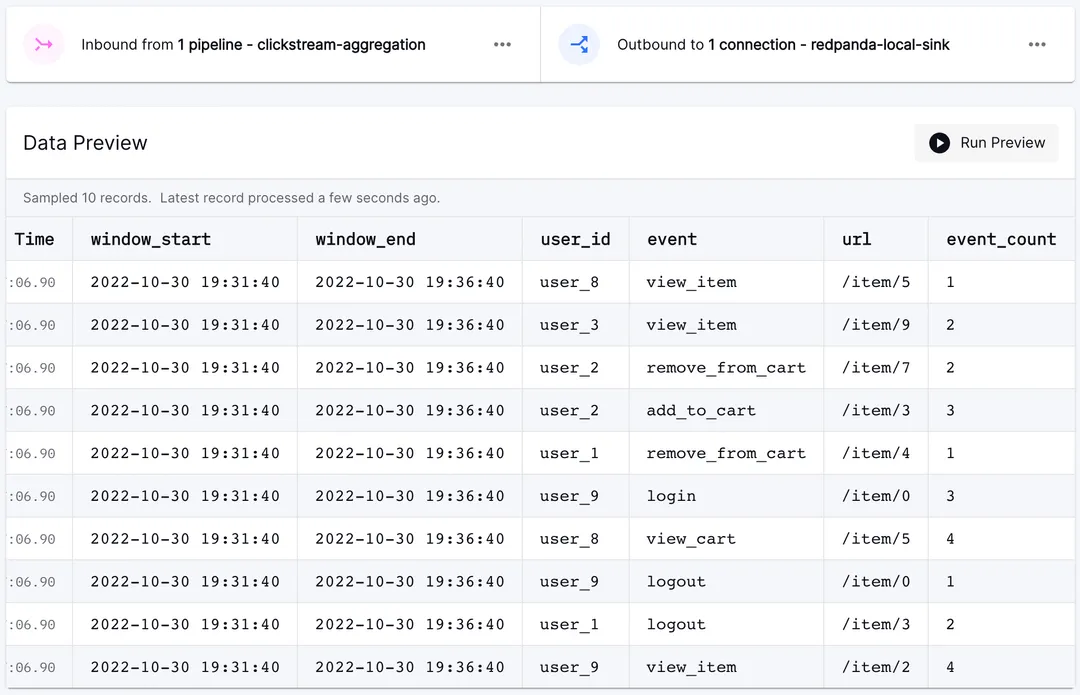
006982ac 1 RUNNINGLet's quickly verify that the pipeline is running. Head over to the Decodable UI and check the status page of the clickstream_aggregated stream. You should see data flowing in and available for preview!
Now for the sink connection:
❯ decodable connection list
id         name                     connector    type         create time                   update time
afe945ab   redpanda-local-sink      redpanda     sink         2022-10-30T19:02:53Z          2022-10-30T19:02:53Z
And the activation command:
❯ decodable connection activate afe945ab

redpanda-local-sink
  id                       15db1739
  description              Sink connector for local Redpanda cluster
  connector                redpanda
  type                     sink
  stream id                7fd1d4ca
  schema
    0  window_start        TIMESTAMP(3) NOT NULL
    1  window_end          TIMESTAMP(3) NOT NULL
    2  user_id             STRING
    3  event               STRING
    4  url                 STRING
    5  event_count         BIGINT NOT NULL
  properties
    bootstrap.servers      5.tcp.eu.ngrok.io:16656
    topic                  clickstream_aggregated
    value.format           json
  target state             RUNNING
  actual state             STARTING
  requested tasks          1
  actual tasks             1
  create time              2022-10-30T19:44:08Z
  update time              2022-10-30T19:44:08Z
  last runtime error       <none>
  metrics                  <none>
After a few seconds, the connection should be active, and you should be able to see the data in the Redpanda topic, running locally with the following command:
docker exec -it redpanda rpk topic consume clickstream_aggregated
And the output will be something like this:
{
  "topic": "clickstream_aggregated",
  "value": "{\"window_start\":\"2022-10-30 19:40:00\",\"window_end\":\"2022-10-30 19:45:00\",\"user_id\":\"user_3\",\"event\":\"add_to_cart\",\"url\":\"/item/4\",\"event_count\":1}",
  "timestamp": 1667159150508,
  "partition": 0,
  "offset": 1621
}
{
  "topic": "clickstream_aggregated",
  "value": "{\"window_start\":\"2022-10-30 19:40:00\",\"window_end\":\"2022-10-30 19:45:00\",\"user_id\":\"user_6\",\"event\":\"view_item\",\"url\":\"/item/5\",\"event_count\":1}",
  "timestamp": 1667159150508,
  "partition": 0,
  "offset": 1622
}
{
  "topic": "clickstream_aggregated",
  "value": "{\"window_start\":\"2022-10-30 19:40:00\",\"window_end\":\"2022-10-30 19:45:00\",\"user_id\":\"user_7\",\"event\":\"view_item\",\"url\":\"/item/6\",\"event_count\":2}",
  "timestamp": 1667159150508,
  "partition": 0,
  "offset": 1623
}
With the aggregated clickstream data being published into Redpanda continuously, we are able to build various things; for example we could create a live dashboards that contain actionable insights, we could build a feature store for an online machine learning algorithm or even write the data back into an operational database for further usage. Stay tuned for future articles about such use cases 👀.
In this tutorial, we've seen how to use Decodable to create a simple clickstream aggregation pipeline. We've seen that with just a few commands, we are able to provision the required resources for a fully managed, highly-available streaming transformation pipeline. With Redpanda, spinning up a local cluster is as easy as running a single command, and testing the end-to-end pipeline took just a few minutes, thanks to the intuitive API of Decodable.
Stream processing has long been a complex and difficult task, but with Decodable and Redpanda, it's now as easy as writing a SQL query. We hope you enjoyed this tutorial and that you'll give Redpanda and Decodable a try!
Take Redpanda for a test drive here. Check out our documentation to understand the nuts and bolts of how the platform works, or read more of our blogs to see the plethora of ways to integrate with Redpanda. To ask our Solution Architects and Core Engineers questions and interact with other Redpanda users, join the Redpanda Community on Slack.
Subscribe to our VIP (very important panda) mailing list to pounce on the latest blogs, surprise announcements, and community events!
Opt out anytime.