
Full CDC semantics land in the Iceberg output for Redpanda Connect
Your lakehouse mirrors the database, instantly.

Learn how to use Trino with Redpanda to run federated queries against a changing data set.


To create a data lake, you can use the official command line client for MinIO, called mc. This can automate the steps of initializing your static data with a Docker container. This container will create a bucket and upload the Apache Parquet® file to it. You can verify the creation of the data lake using a Docker Compose command.
Redpanda’s Kafka API compatibility allows you to set up a data generator as if you were writing an application that interacts with Kafka. You can specify the list of brokers to connect to Redpanda and create your destination topic if it doesn't already exist. The data pushed to Redpanda will include user_id, timestamp of the event in ISO 8601 format, the event name, and the event value.
Trino is used to run federated queries against a slowly changing data set that lives in an S3-like object storage, combined with streaming data from a Redpanda topic. Trino requires a few backend components to function, like the Hive metastore and a relational database. It is an SQL-compliant query engine compatible with numerous data sources and various business intelligence tools.
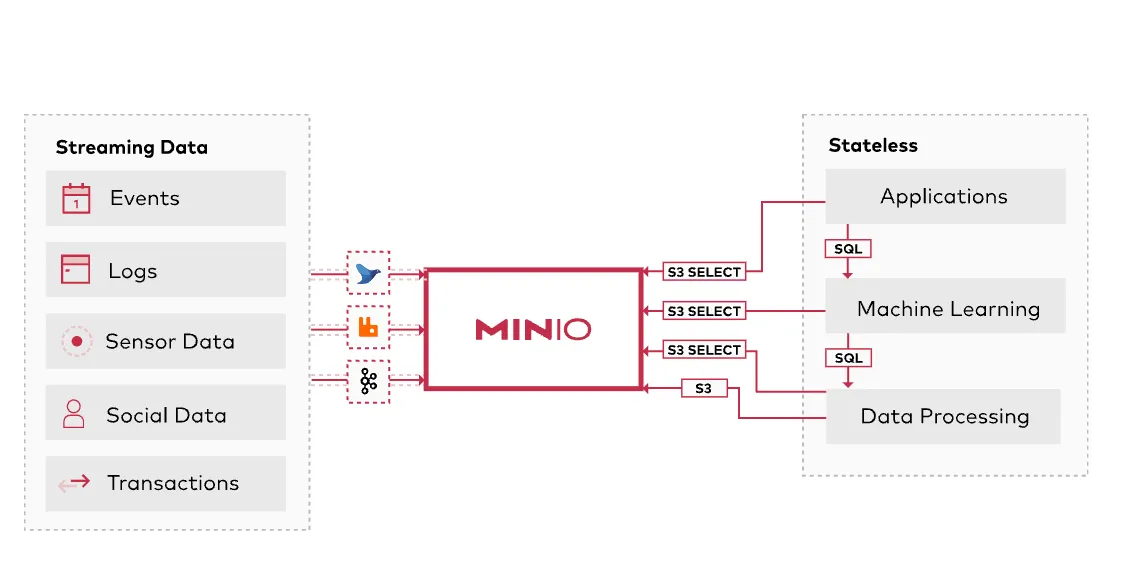
MinIO is an S3-compatible object storage that can be self-hosted. It serves as the storage layer over files in the data lake setup. It helps in building downstream components in the same manner as if using S3, facilitating faster development cycles.
Redpanda serves as the event storage of your application in a data lake architecture. It is responsible for the live, streaming data side. This streaming data can be combined with other data housed in a data lake, like S3 or Google Cloud Storage, to unlock analytical insights.
The tutorial uses mock event data that resembles users interacting with a website. This "slowly-changing" data set will live in MinIO. The data can be exported to a CSV file and then converted into parquet format with a Python script for optimization. The streaming side of the data set will be generated by another Python script.
Data lakes are a great way to store almost any type of data. Yet, if you want to combine them with incoming streams of data, the complexity of writing extract and load pipelines to get all your messages in one place for analytical querying can be burdensome.
In such a case, you can use a streaming data platform like Redpanda as the event storage of your application, and a data lake like S3 or Google Cloud Storage to house various other data that you collect from different sources. Combining this data to unlock its analytical treasures is easier than it sounds.
In this tutorial, we walk through an example setup where we use Trino to run federated queries against a slowly changing data set that lives in an S3-like object storage (MinIO), combined with streaming data from a Redpanda topic.
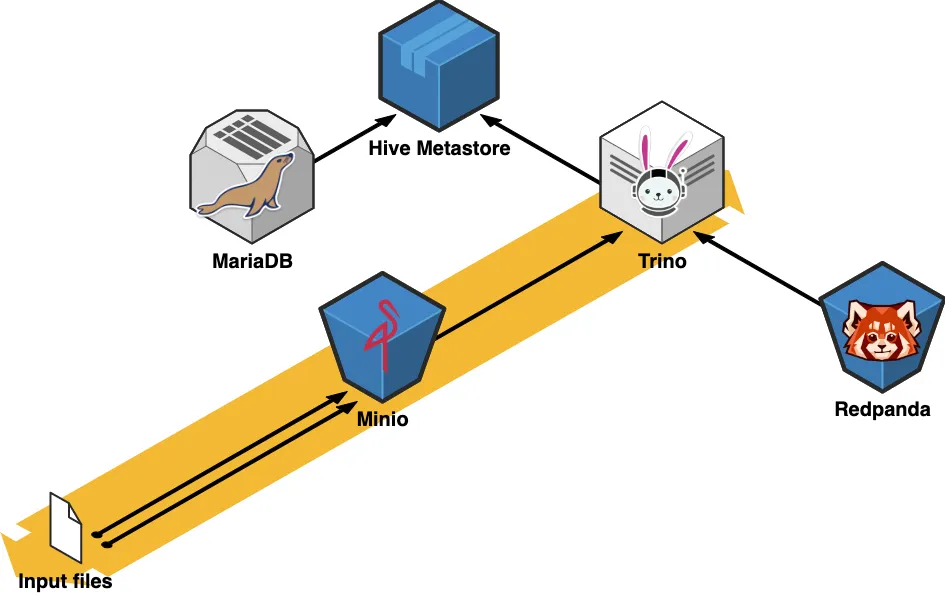
In the architecture diagram above, we get a glimpse of how the various components of this architecture interact with each other. MinIO serves as the storage layer over our files in the “data lake” while Redpanda is responsible for the live, streaming data side. Both sources are queried through Trino, the SQL-based execution engine. Trino requires a few backend components to function, like the Hive metastore and a relational database, for which we will use a plain MariaDB instance.
You can access the demo code for this tutorial at any time in this GitHub repo.
The data lake portion of our setup consists of two main components: the storage layer and the query engine layer, which is responsible for executing the queries.
This is how they look in detail:
MinIO delivers scalable, secure, S3-compatible object storage. It can be self-hosted, which means we can build our downstream components on top of it in the same manner as if we were using S3. This compatibility helps with prototyping and makes development cycles faster than having to spin up an AWS infrastructure.
As with the other services we’ll cover in this demo, we deploy MinIO via Docker Compose:
minio:
  hostname: minio
  image: 'minio/minio:latest'
  container_name: minio
  ports:
    - "9001:9001"
    - "9000:9000"
  command: [ "server", "/data", "--console-address", ":9001" ]
  volumes:
    - minio-data:/data
  environment:
    MINIO_ROOT_USER: minio
    MINIO_ROOT_PASSWORD: minio123
    MINIO_ACCESS_KEY: minio
    MINIO_SECRET_KEY: minio123
  networks:
    - trino
To create our "data lake" (e.g. load a file from our file system into the object storage) we can use the official command line client for MinIO, called mc. With mc, we can automate the steps of initializing our static data with a Docker container like this:
mc:
  depends_on:
    - minio
  image: minio/mc
  container_name: mc
  entrypoint: >
    /bin/sh -c "
    until (/usr/bin/mc config host add minio http://minio:9000 minio minio123) do echo '...waiting...' && sleep 1; done;
    /usr/bin/mc rm -r --force minio/users;
    /usr/bin/mc mb minio/users;
    /usr/bin/mc policy set public minio/users;
    /usr/bin/mc cp /data/mock_user_data.parq minio/users/mock_user_data.parq;
    exit 0;
    "
  networks:
    - trino
  volumes:
    - ./data/mock_user_data.parq:/data/mock_user_data.parq
This container will create a bucket called minio/users and upload the Apache Parquet® file mock_user_data.parq to it. (If you’re wondering where this parquet file came from, don’t worry - we'll discuss that in the next section.)
So far, if we run the following Docker Compose command…
docker-compose up minio mc
…we'll have our data lake ready to go in a second. To verify this step the output should look like this:
minio  |
minio  | Status:         1 Online, 0 Offline.
minio  | API: http://172.24.0.2:9000  http://127.0.0.1:9000
minio  | Console: http://172.24.0.2:9001 http://127.0.0.1:9001
minio  |
minio  | Documentation: https://docs.min.io
mc     | Remove `minio/users/mock_user_data.parq`.
mc     | mc: <ERROR> Unable to make bucket `minio/users`. Your previous request to create the named bucket succeeded and you already own it.
mc     | Access permission for `minio/users` is set to `public`
mc     | `/data/mock_user_data.parq` -> `minio/users/mock_user_data.parq`
mc | Total: 0 B, Transferred: 58.38 KiB, Speed: 1.59 MiB/sTrino is an SQL-compliant query engine that is compatible with numerous data sources as well as various business intelligence tools, such as Tableau and Power BI. Trino has built-in connectors for most commonly-used data storage options, like Hive, PostgreSQL, BigQuery, and Apache Kafka®.
Trino has three main components:

The Coordinator and Worker will live in the same service for demonstration purposes but in a production environment, to achieve scalability and high availability, they should be run separately. This can be achieved via Docker:
trino-coordinator:
  container_name: trino-coordinator
  image: 'trinodb/trino:latest'
  hostname: trino-coordinator
  ports:
    - '8080:8080'
  volumes:
    - ./etc:/etc/trino
  networks:
- trinoOur tables will be defined through the Hive metastore (HMS). HMS is the catalog of all the collections held in our object storage. When new data is inserted into our tables, HMS takes care of registering the schema and other metadata in a durable database for us. The HMS is a simple service with a binary API using the Thrift protocol. The metadata that HMS updates lives in a MariaDB instance.
The relevant Docker Compose snippet looks like this:
hive-metastore:
  container_name: hive-metastore
  hostname: hive-metastore
  image: 'bitsondatadev/hive-metastore:latest'
  ports:
    - '9083:9083'
  volumes:
    - ./conf/metastore-site.xml:/opt/apache-hive-metastore-3.0.0-bin/conf/metastore-site.xml:ro
  environment:
    METASTORE_DB_HOSTNAME: mariadb
  depends_on:
    - mariadb
  networks:
    - trino

mariadb:
  container_name: mariadb
  image: 'mariadb:latest'
  hostname: mariadb
  ports:
    - '3306:3306'
  environment:
    MYSQL_ROOT_PASSWORD: admin
    MYSQL_USER: admin
    MYSQL_PASSWORD: admin
    MYSQL_DATABASE: metastore_db
  volumes:
    - ./metastore-data:/var/lib/mysql
  networks:
    - trino
The metastore-site.xml file is used to configure the metastore so it can access the database and MinIO. The HMS is configured via the file /etc/catalog/hive.properties. This tells Trino how to access the metastore and the object storage.
connector.name=hive-hadoop2
hive.metastore.uri=thrift://hive-metastore:9083
hive.s3.path-style-access=true
hive.s3.endpoint=http://minio:9000
hive.s3.aws-access-key=minio
hive.s3.aws-secret-key=minio123
The Redpanda connection configuration lives in /etc/catalog/kafka.properties.
The contents of this configuation file are fairly minimal: It simply specifies how Trino will be able to find our Redpanda broker and which topic it should ingest from. The kafka.table-names is the property that specifies the topic name.
connector.name=kafka
kafka.nodes=redpanda:9092
kafka.table-names=user_events
kafka.hide-internal-columns=false
Let's spin up every service required for our example and continue with the streaming setup!
docker-compose up trino-coordinator mariadb hive-metastore minio mc
For the streaming part of our project, we will use Redpanda, a Kafka API-compatible event streaming engine that is faster, simpler, and more reliable. This API compatibility will help us set up the connection between our live data and our data lake, as our query-engine, Trino, has a working Kafka connector already built.
For more information about the Trino connector, head over to the official documentation here.
For this tutorial, we will use mock event data that resembles users interacting with a website. To generate our "slowly-changing" data set that will live in MinIO, we can use mockaroo. The generated data that we export to a csv file will look like this:
user_id,first_name,last_name,email,gender,ip_address
1,Kim,Saltman,ksaltman0@mlb.com,Female,177.38.222.225
2,Waldo,Ducker,wducker1@newyorker.com,Male,117.68.143.132
3,Iona,Sabater,isabater2@ft.com,Female,233.154.142.64
4,Kelly,Hawyes,khawyes3@rediff.com,Male,121.243.56.88
5,Dulciana,Foxley,dfoxley4@irs.gov,Female,140.138.88.205
6,Monti,Dryden,mdryden5@dailymotion.com,Genderfluid,59.230.189.110
7,Hersch,Nind,hnind6@networksolutions.com,Male,254.181.254.158
8,Renard,Scheffel,rscheffel7@elegantthemes.com,Male,48.115.25.158
9,Asa,Croydon,acroydon8@mit.edu,Male,83.77.36.108
10,Mace,Olekhov,molekhov9@patch.com,Genderfluid,74.185.165.15
In order to optimize our data lake, let's convert this file into parquet format with a simple Python script. Parquet is designed as a columnar storage format to support complex data processing. It is a self-describing data format that embeds the schema or structure within the data itself. This will make loading our data a bit easier as we can catch issues with it earlier.
import pandas as pd

def csv_to_parquet(csv_file, parquet_file):
    df = pd.read_csv(csv_file)
    df.to_parquet(parquet_file)

if __name__ == "__main__":
    csv_to_parquet("mock_user_data.csv", "mock_user_data.parq")
This concludes the static side of our data set up. The streaming side will be generated by a Python script. In our final queries, we will want to be able to join the two data sets on the user_id field, so our script will include that as well.
The main data generation part involves only a few lines of code:
MOCK_EVENTS = [
    "email_click",
    "link_1_click",
    "link_2_click",
    "pdf_download",
    "video_play",
    "website_visit",
]

# Generate randomized user event data for a non-existing website
data = {
    "timestamp": datetime.now().isoformat(),  # ISO 8601 timestamp, because Trino can easily parse this
    "event_name": random.choice(MOCK_EVENTS),
    "event_value": randint(0, 1),
}

# Send the data to the Redpanda topic
key = str(randint(0, 1000)).encode("utf-8")
value = json.dumps(data).encode("utf-8")
producer.send(
    EVENTS_TOPIC_NAME,
    key=key,
    value=value,
)
We'll choose one event from our list of mock events and send it to the Redpanda topic.
Redpanda’s Kafka API compatibility lets us set up this data generator as if we were writing an application that interacts with Kafka. To connect to Redpanda, we just have to specify the list of brokers, which will have a different hostname based on the environment we are currently using.
BOOTSTRAP_SERVERS = (
    "redpanda:9092"
    if os.getenv("RUNTIME_ENVIRONMENT") == "DOCKER"
    else "127.0.0.1:54810"
)

producer = KafkaProducer(bootstrap_servers=BOOTSTRAP_SERVERS)
With the Admin API, we can also create our destination topic if it doesn't already exist.
# Create kafka topics if running in Docker.
admin_client = KafkaAdminClient(
    bootstrap_servers=BOOTSTRAP_SERVERS, client_id="user-event-producer"
)
# Check if topic already exists first
existing_topics = admin_client.list_topics()
if EVENTS_TOPIC_NAME not in existing_topics:
    admin_client.create_topics(
        [NewTopic(EVENTS_TOPIC_NAME, num_partitions=1, replication_factor=1)]
    )
The data we push to Redpanda will look like this:
Key:
123Value:
The key is the user_id, which is a randomly generated integer in this case, but we should be able to match it to our static data set, as that contains integers from 1 to 1000 as well. The value has the timestamp of the event in ISO 8601 format, the event name, and the event value.
To run the data generator we can use the following command:
docker-compose up redpanda producerThis will spin up our local Redpanda cluster and start the producer. The logs will look as follows:
producer  | Sent data to Redpanda topic user_events: b'672' - b'{"timestamp": "2022-08-07T13:56:59.810898", "event_name": "link_1_click", "event_value": 1}', sleeping for 1 second
producer  | Sent data to Redpanda topic user_events: b'696' - b'{"timestamp": "2022-08-07T13:56:59.921337", "event_name": "link_2_click", "event_value": 1}', sleeping for 1 second
producer  | Sent data to Redpanda topic user_events: b'364' - b'{"timestamp": "2022-08-07T13:57:00.033599", "event_name": "video_play", "event_value": 1}', sleeping for 1 second
producer  | Sent data to Redpanda topic user_events: b'318' - b'{"timestamp": "2022-08-07T13:57:00.171738", "event_name": "pdf_download", "event_value": 1}', sleeping for 1 second
producer  | Sent data to Redpanda topic user_events: b'951' - b'{"timestamp": "2022-08-07T13:57:00.271481", "event_name": "email_click", "event_value": 0}', sleeping for 1 second
producer  | Sent data to Redpanda topic user_events: b'118' - b'{"timestamp": "2022-08-07T13:57:00.813905", "event_name": "website_visit", "event_value": 0}', sleeping for 1 second
producer  | Sent data to Redpanda topic user_events: b'525' - b'{"timestamp": "2022-08-07T13:57:00.924928", "event_name": "pdf_download", "event_value": 1}', sleeping for 1 second
producer  | Sent data to Redpanda topic user_events: b'461' - b'{"timestamp": "2022-08-07T13:57:01.035165", "event_name": "link_2_click", "event_value": 0}', sleeping for 1 second
There is a short sleep included in the producer for easier testing.
Kafka data is unstructured, and it has no metadata to describe the format of the messages. Without further configuration, the Kafka connector can access the data, and map it in raw form. However, there are no actual columns besides the built-in ones:
trino --server http://localhost:8080 --catalog kafka --schema default

trino:kafka> DESCRIBE user_events
      Column       |  Type      | Extra |                   Comment
-------------------+------------+-------+---------------------------------------------
 _partition_id     | bigint     |       | Partition Id
 _partition_offset | bigint     |       | Offset for the message within the partition
 _key              | varchar    |       | Key text
 _key_corrupt      | boolean    |       | Key data is corrupt
 _key_length       | bigint     |       | Total number of key bytes
 _message          | varchar    |       | Message text
 _message_corrupt  | boolean    |       | Message data is corrupt
 _message_length   | bigint     |       | Total number of message bytes
 _timestamp        | timestamp  |       | Message timestamp
The data from Redpanda can already be queried using Trino, but it is not yet in actual table shape. The raw data is available through the _message and _key columns, but it is not decoded into columns. As the sample data is in JSON format, the JSON functions and operators built into Trino can be used to slice the data.
The Trino Kafka connector supports topic description files to turn raw data into table format. These files are located in the etc/kafka folder in the Trino installation and must end with .json. It is recommended that the file name matches the table name, but this is not necessary.
We have created a schema description file for our topic. It looks like this:
{
  "tableName": "user_events",
  "schemaName": "default",
  "topicName": "user_events",
  "dataFormat": "json",
  "key": {
    "dataFormat": "raw",
    "fields": [
      {
        "name": "user_id",
        "type": "VARCHAR",
        "hidden": "false"
      }
    ]
  },
  "message": {
    "dataFormat": "json",
    "fields": [
      {
        "name": "timestamp",
        "mapping": "timestamp",
        "type": "VARCHAR"
      },
      {
        "name": "event_name",
        "mapping": "event_name",
        "type": "VARCHAR"
      },
      {
        "name": "event_value",
        "mapping": "event_value",
        "type": "VARCHAR"
      }
    ]
  }
}
This file is saved as default.user_events.json in the etc/kafka folder and gets copied into our Docker image.
Having the schema description file, we can now query the data:
select user_id, event_name, event_value, timestamp
from user_events
This gives us the following output:
 user_id  |  event_name   | event_value |         timestamp
-----------+---------------+-------------+----------------------------
 212       | link_2_click  | 1           | 2022-08-07T14:13:39.913034
 855       | pdf_download  | 1           | 2022-08-07T14:13:39.813920
 472       | email_click   | 1           | 2022-08-07T14:13:39.710912
 996       | link_1_click  | 0           | 2022-08-07T14:13:39.627793
 576       | video_play    | 1           | 2022-08-07T14:13:39.575833
 225       | video_play    | 0           | 2022-08-07T14:13:38.910753
 889       | video_play    | 1           | 2022-08-07T14:13:38.812830
 920       | link_2_click  | 0           | 2022-08-07T14:13:38.708060
We now have enough infrastructure to combine the streaming data with our static file!
Now that we have both the static and streaming data, we can start building our queries on top of them.
To start the complete data lake portion of our project, run:
docker-compose up trino-coordinator mariadb hive-metastore minio mc
This will spin up every dependency required for Trino, including the HMS, the MariaDB backend, and it will also start the MinIO server and copy the Parquet file to a bucket.
To start the streaming side of the project, run:
docker-compose up redpanda producer
With everything now running, all we need to do is grab the Trino client so we can connect to the server and run some queries! The required installation steps are detailed here.
To connect to our Trino server, use the following command:
trino --server http://localhost:8080
Before we are able to query our data from the Parquet file, we need to create a schema and a table in the HMS. This can be done with a few SQL statements:
USE hive;

CREATE SCHEMA IF NOT EXISTS users
    WITH (location = 's3a://users/');

CREATE TABLE IF NOT EXISTS hive.users.user_data
(
    user_id    INT,
    first_name VARCHAR,
    last_name  VARCHAR,
    email      VARCHAR,
    gender     VARCHAR,
    ip_address VARCHAR
)
WITH ( external_location = 's3a://users/',
    format = 'PARQUET');
These commands will create a schema called users and a table called user_data for us in the HMS with an external location pointing to our Parquet file.
Now we are able to query our parquet file thanks to HMS. To verify, run this command:
select *
from hive.users.user_data;
This will give us:
user_id |  first_name  |   last_name    |               email                |   gender    |   ip_address
---------+--------------+----------------+------------------------------------+-------------+-----------------
       1 | Kim          | Saltman        | ksaltman0@mlb.com                  | Female      | 177.38.222.225
       2 | Waldo        | Ducker         | wducker1@newyorker.com             | Male        | 117.68.143.132
       3 | Iona         | Sabater        | isabater2@ft.com                   | Female      | 233.154.142.64
       4 | Kelly        | Hawyes         | khawyes3@rediff.com                | Male        | 121.243.56.88
       5 | Dulciana     | Foxley         | dfoxley4@irs.gov                   | Female      | 140.138.88.205
       6 | Monti        | Dryden         | mdryden5@dailymotion.com           | Genderfluid | 59.230.189.110
       7 | Hersch       | Nind           | hnind6@networksolutions.com        | Male        | 254.181.254.158
       8 | Renard       | Scheffel       | rscheffel7@elegantthemes.com       | Male        | 48.115.25.158
       9 | Asa          | Croydon        | acroydon8@mit.edu                  | Male        | 83.77.36.108
      10 | Mace         | Olekhov        | molekhov9@patch.com                | Genderfluid | 74.185.165.15
To combine the two data sets, we can use standard SQL!
select d.email,
       d.first_name,
       d.last_name,
       d.gender,
       d.ip_address,
       e.event_name,
       e.event_value,
       from_iso8601_timestamp(e.timestamp) as timestamp
from hive.users.user_data d
As we can see in the results, the data has been successfully joined together:
       email            | first_name | last_name  |   gender    |   ip_address    |  event_name   | event_value |               timestamp
-----------------------------+------------+------------+-------------+-----------------+---------------+-------------+---------------------------------------
 amingotti1b@cloudflare.com  | Aviva      | Mingotti   | Agender     | 224.97.194.116  | video_play    | 1           | 2022-08-07 11:38:08.108 Europe/Lisbon
 amingotti1b@cloudflare.com  | Aviva      | Mingotti   | Agender     | 224.97.194.116  | video_play    | 1           | 2022-08-07 11:33:14.970 Europe/Lisbon
 amingotti1b@cloudflare.com  | Aviva      | Mingotti   | Agender     | 224.97.194.116  | website_visit | 1           | 2022-08-07 11:29:52.248 Europe/Lisbon
 vgiraudoux1c@alibaba.com    | Verine     | Giraudoux  | Female      | 42.225.222.245  | video_play    | 0           | 2022-08-07 11:39:35.480 Europe/Lisbon
 vgiraudoux1c@alibaba.com    | Verine     | Giraudoux  | Female      | 42.225.222.245  | link_2_click  | 1           | 2022-08-07 11:39:34.452 Europe/Lisbon
 vgiraudoux1c@alibaba.com    | Verine     | Giraudoux  | Female      | 42.225.222.245  | link_1_click  | 0           | 2022-08-07 11:39:32.444 Europe/Lisbon
 vgiraudoux1c@alibaba.com    | Verine     | Giraudoux  | Female      | 42.225.222.245  | email_click   | 1           | 2022-08-07 11:39:28.420 Europe/Lisbon
 vgiraudoux1c@alibaba.com    | Verine     | Giraudoux  | Female      | 42.225.222.245  | email_click   | 0           | 2022-08-07 11:39:26.409 Europe/Lisbon
 vgiraudoux1c@alibaba.com    | Verine     | Giraudoux  | Female      | 42.225.222.245  | website_visit | 1           | 2022-08-07 11:39:26.410 Europe/Lisbon
 vgiraudoux1c@alibaba.com    | Verine     | Giraudoux  | Female      | 42.225.222.245  | video_play    | 0           | 2022-08-07 11:39:24.402 Europe/Lisbon
 vgiraudoux1c@alibaba.com    | Verine     | Giraudoux  | Female      | 42.225.222.245  | link_1_click  | 0           | 2022-08-07 11:39:20.388 Europe/Lisbon
 vgiraudoux1c@alibaba.com    | Verine     | Giraudoux  | Female      | 42.225.222.245  | video_play    | 1           | 2022-08-07 11:39:20.386 Europe/Lisbon
 vgiraudoux1c@alibaba.com    | Verine     | Giraudoux  | Female      | 42.225.222.245  | video_play    | 1           | 2022-08-07 11:39:18.381 Europe/Lisbon
 vgiraudoux1c@alibaba.com    | Verine     | Giraudoux  | Female      | 42.225.222.245  | link_2_click  | 0           | 2022-08-07 11:39:14.363 Europe/Lisbon
As an example on how to write queries that calculate metrics, let's count the total number of events for each user:
select d.email,
       e.event_name,
       count(*)                                 event_count,
       max(from_iso8601_timestamp(e.timestamp)) latest_event_timestamp
from hive.users.user_data d
         join kafka.default.user_events e on e.user_id = d.user_id
group by d.email, e.event_name
order by d.email, e.event_name;
As expected, our results are:
  email            |  event_name   | event_count |        latest_event_timestamp
-----------------------------+---------------+-------------+---------------------------------------
 amingotti1b@cloudflare.com  | video_play    |           2 | 2022-08-07 11:38:08.108 Europe/Lisbon
 amingotti1b@cloudflare.com  | website_visit |           1 | 2022-08-07 11:29:52.248 Europe/Lisbon
 cjeffray1i@goodreads.com    | email_click   |          69 | 2022-08-07 11:40:00.565 Europe/Lisbon
 cjeffray1i@goodreads.com    | link_1_click  |          65 | 2022-08-07 11:39:59.563 Europe/Lisbon
 cjeffray1i@goodreads.com    | link_2_click  |          61 | 2022-08-07 11:39:58.566 Europe/Lisbon
 cjeffray1i@goodreads.com    | pdf_download  |          60 | 2022-08-07 11:39:40.492 Europe/Lisbon
 cjeffray1i@goodreads.com    | video_play    |          65 | 2022-08-07 11:40:01.565 Europe/Lisbon
 cjeffray1i@goodreads.com    | website_visit |          69 | 2022-08-07 11:40:01.564 Europe/Lisbon
 cseignior1g@ifeng.com       | email_click   |          56 | 2022-08-07 11:39:42.483 Europe/Lisbon
 cseignior1g@ifeng.com       | link_1_click  |          58 | 2022-08-07 11:40:05.585 Europe/Lisbon
 cseignior1g@ifeng.com       | link_2_click  |          62 | 2022-08-07 11:40:02.567 Europe/Lisbon
 cseignior1g@ifeng.com       | pdf_download  |          59 | 2022-08-07 11:40:08.600 Europe/Lisbon
 cseignior1g@ifeng.com       | video_play    |          56 | 2022-08-07 11:39:48.511 Europe/Lisbon
 cseignior1g@ifeng.com       | website_visit |          52 | 2022-08-07 11:40:11.622 Europe/Lisbon
To verify that our results keep up with the new data we are continuously ingesting, let's run the same query again and check the results:
 email            |  event_name   | event_count |        latest_event_timestamp
-----------------------------+---------------+-------------+---------------------------------------
 amingotti1b@cloudflare.com  | video_play    |           2 | 2022-08-07 11:38:08.108 Europe/Lisbon
 amingotti1b@cloudflare.com  | website_visit |           1 | 2022-08-07 11:29:52.248 Europe/Lisbon
 cjeffray1i@goodreads.com    | email_click   |          73 | 2022-08-07 11:40:35.719 Europe/Lisbon
 cjeffray1i@goodreads.com    | link_1_click  |          69 | 2022-08-07 11:40:39.738 Europe/Lisbon
 cjeffray1i@goodreads.com    | link_2_click  |          64 | 2022-08-07 11:40:33.712 Europe/Lisbon
 cjeffray1i@goodreads.com    | pdf_download  |          61 | 2022-08-07 11:40:25.678 Europe/Lisbon
 cjeffray1i@goodreads.com    | video_play    |          65 | 2022-08-07 11:40:01.565 Europe/Lisbon
 cjeffray1i@goodreads.com    | website_visit |          72 | 2022-08-07 11:40:38.733 Europe/Lisbon
 cseignior1g@ifeng.com       | email_click   |          61 | 2022-08-07 11:40:39.738 Europe/Lisbon
 cseignior1g@ifeng.com       | link_1_click  |          62 | 2022-08-07 11:40:37.723 Europe/Lisbon
 cseignior1g@ifeng.com       | link_2_click  |          64 | 2022-08-07 11:40:22.663 Europe/Lisbon
 cseignior1g@ifeng.com       | pdf_download  |          60 | 2022-08-07 11:40:17.638 Europe/Lisbon
 cseignior1g@ifeng.com       | video_play    |          58 | 2022-08-07 11:40:23.669 Europe/Lisbon
 cseignior1g@ifeng.com       | website_visit |          55 | 2022-08-07 11:40:25.674 Europe/Lisbon
The count values have increased, meaning our data ingestion is being considered by our queries. Success!
The opportunities for such an application are endless. Using event timestamps, we can calculate basically any time-based metric we want, while also keeping in-sync with our slowly changing data in our object storage. This functionality has many different uses, including clickstream analytics with customer or user lookups, infrastructure operations analysis, sales analysis, and many other real-time analytics use cases.
The Kafka API-compatibility and ease of deployment of Redpanda allows us to take existing infrastructure elements and replace it with a scalable and persistent event streaming engine like Redpanda. This makes for an easy development environment setup that - with minimal changes - can also be used in production at full scale, meeting your operational and resiliency requirements.
If you have any questions about running this demo, please ask them in the Redpanda Community on Slack. As a reminder, all code for this tutorial is accesible in this GitHub repo, and you can find Redpanda’s main project here.
Subscribe to our VIP (very important panda) mailing list to pounce on the latest blogs, surprise announcements, and community events!
Opt out anytime.