
Building safe, multi-agent AI systems in Redpanda Agentic Data Plane
How we revamped our Redleader agent to enable governed, multi-agent AI for the enterprise
Benchmarking Redpanda and Apache Kafka.
Redpanda contributes to operational simplicity by focusing on predictability. It ensures understandable, flat-tail latencies, which is crucial for big-data and real-time systems. It also provides predictability in the way the product breaks in case of network partitions, bad disks, etc., and in how performance degrades as a function of hardware saturation. This predictability allows for accurate planning for product launches and development.
Redpanda operates in safe mode (flushing after every batch) with acks=all. This means that it ensures data safety by replicating the data to 3 nodes in total with no lag and flushing data after every batch. This approach helps in maintaining data integrity while also ensuring high performance.
One of the key architectural differences is that Redpanda bypasses the kernel's page cache, which allows it to be predictable with respect to both failure semantics and tail latency. Redpanda understands exactly how much data is going to be needed next, the access patterns which mostly move forward, update frequency, background operations, and cache prioritization. This approach helps in reducing latency and nondeterministic I/O behavior.
Redpanda aims to bring operational simplicity to the existing overwhelming complexity of standing up state-of-the-art streaming systems. It focuses on data safety and performance, controlling the information flow of how, when, and where things are stored, transferred, accessed, mutated, and eventually delivered.
Tail latency is important because it impacts user operations or API calls. As the volume of interactions and messages between systems using the Kafka API increases, so does the probability that a single user operation or API call is affected by latencies above the 99.99th percentile. Therefore, minimizing tail latency is crucial for efficient data processing and transfer.
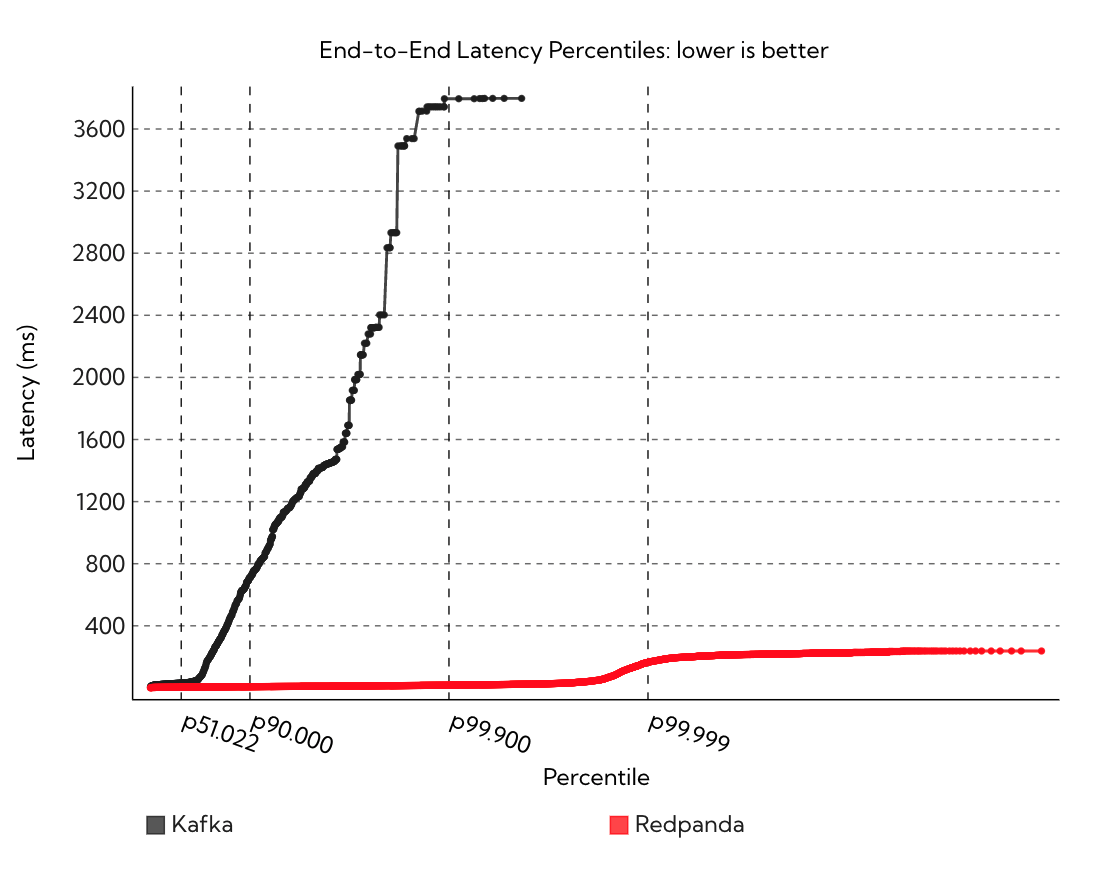
1250k msg/sec - 1KB payload -ack=all-fsyncafter every batch - 1 hour benchmark
This blog post represents months of work and over 400+ hours of actual benchmarking where we compared Redpanda and the latest 2.7 Kafka Release. We used the recommended production setup and environment from Confluent’s fork of the CNCF open messaging benchmark.
The Apache Kafka® API has emerged as the lingua franca for streaming workloads. Developers love the ecosystem and being able to turn sophisticated products overnight. Just like Apache and Nginx have their own HTTP implementations, gccgo, and the Go compiler specifies parsers for the language, MySQL and Postgres implement SQL, and Redpanda and Kafka implement the Kafka API. Redpanda aims to bring operational simplicity to the existing overwhelming complexity of standing up state-of-the-art streaming systems. This manifests at its lowest level in no longer having to choose between data safety and performance.
Let’s be clear, the reason tail latency matters in the world of big data is because Redpanda does not exist in isolation. It often sits between your web servers, databases, internal microservices, data lakes, etc. Redpanda controls the information flow of how, when and where things are stored, transferred, accessed, mutated and eventually delivered. The reason we obsess over tail latency is because the p99.99 in a messaging system happens often - it’s a simple function of the messages exchanged. As the volume of interactions and messages between systems using the Kafka API increases, so does the probability that a single user operation or API call is affected by latencies above the 99.99th percentile.
The Kafka API is good, below, we showcase how we made it fast.
We present 18 workloads below. All workloads for both systems replicate the data to 3 nodes in total with no lag (manually verified in the quorum system). The only difference is that Apache Kafka was run with in-memory replication (using the page-cache) and flushing after every message. Redpanda can only be operated in safe mode (flushing after every batch) with acks=all. The benchmarks below are the same benchmarks Alok Nikhil & Vinoth Chandar from Confluent performed while comparing Pulsar and Kafka with a 1.2GB/s extension, using the same CNCF Open Messaging Benchmark suite.
First, we note that we were only able to reproduce Confluent’s first 6 results. For the other three workloads, the data shows that it is in fact impossible to achieve sustained network throughput above 300MB/s on AWS on i3en.2xlarge instances. Please see our Benchmark Appendix section at the end for a detailed explanation. We also change the default 1-minute warmup time to 30 minutes to account for common pitfalls in Virtual Machine benchmarking practices and focus entirely on steady-state performance. We then ran each workload for 60 additional minutes, recorded the results, and repeated the steps, taking the best run of each system. That is, each time we ran the benchmarks it took over 54 hours to finish.
For all workloads, we used two m5n.8xlarge for the clients, with 32-cores and with 25Gbps of guaranteed networking throughput and 128GB of memory to ensure the bottleneck would be on the server-side. The benchmark used three i3en.6xlarge 24-core instances with 192GB of memory, 25Gbps guaranteed networking, and two NVMe SSD devices.
We note that after spending several hundreds of hours benchmarks, we had to scale up Confluent’s Kafka settings to keep up with larger instances to num.replica.fetchers=16, message.max.bytes=10485760, replica.fetch.max.bytes=10485760, num.network.threads=16, num.io.threads=16, log.flush.interval.messages=1. Otherwise, the gap between Redpanda and Kafka would be much larger. This had the unfortunate effect that for lower percentiles, Kafka’s latency was a little higher than using half as many threads as specified by Confluent’s Github repo.
All the latencies below are the end-to-end p99.999 latency with 16 producers and 16 consumers with 100 partitions on a single topic. Every message represents 1KB of data. We note that by and large Kafka is able to keep up on throughput except for a couple of workloads with acks=all where Redpanda is better. The meaningful differences are in latency: how fast can each system go.
fsync() with every batch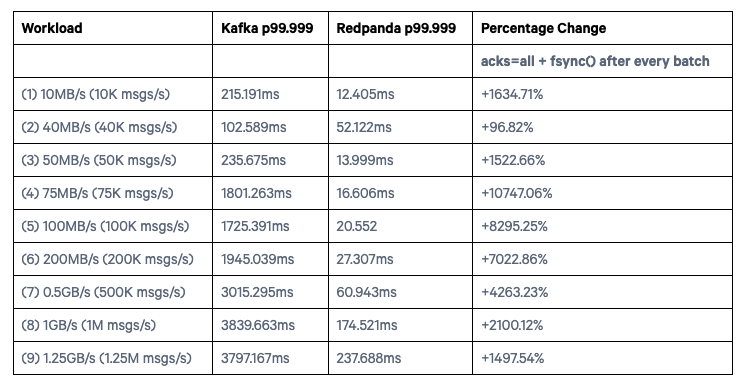
Percentage Change was computed using: ((v2-v1)/abs(v1))*100
Note: All of our work is source-available on GitHub. Safe workloads meanacks=allandfsyncafter every batch before returning to the client.
fsync()-ing after every batch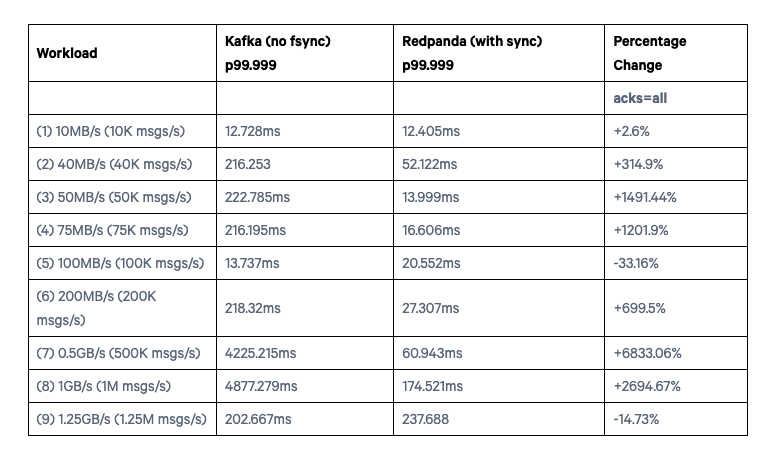
Workload (5) is a bug on our write-behind strategy: issue #542
We’ve said this ad nauseam: Hardware is the platform. Modern hardware is capable of giving you both low latency and no data loss (fsync). Let’s talk about most of the meaningful low-level architectural differences that get us there.

When we started building Redpanda, the main driving factor was understandability. Above performance, we wanted a simple mental model of what it meant to have 2 out of 3 replicas up and running, which is how we ended with Raft - a protocol with a mathematical proof of correctness & log completeness and a focus on usability as part of its design goals.
However, once you get your replication model set, the rest of the life of the product is spent on predictability, and for big-data and real-time systems, that means understandable, flat-tail latencies. It is not enough to be fast. It is not enough to be safe. When trying to handle hundreds of terabytes per day of streaming you need to be predictable not only in the way the product breaks in case of network partitions, bad disks, etc., but also in how performance degrades as a function of hardware saturation. This is at the core of operational simplicity for streaming systems.
Modern hardware allows us to finally have nice things. It is not the case anymore that you have to choose between safety (no data loss) and speed (low latency). Furthermore, this predictability affords you accurate planning for product launches. As a user, I understand how to buy hardware. I will perform a fio test and have a decent understanding of what that specific hardware can do. Redpanda lets you take these hardware saturation numbers and gives you a reasonable chance of predicting how costly it is to develop a new product.
Without further ado, let me count the ways:
The page cache is an object in the Linux kernel. It is maintained per file with global locking semantics. It is a tried and true, generic scheduling mechanism with heuristics from a variety of production use cases that push and pull the design to a really good middle ground. It aims to never be a bad choice if you need to do I/O. However, for our specific use case - a log - we can do much better. We understand exactly, all the way to the user application, how much data is going to be needed next, the access patterns which mostly move forward, update frequency, background operations, and cache prioritization.
For us, the page cache introduces latency and nondeterministic I/O behavior. For example, when loading data for a Kafka fetch request the Linux Kernel will trigger general-purpose read-ahead heuristics, and cache the bytes it read, take a global lock, and update indexes. Redpanda does not do general I/O. It is a log, append-only, with well-understood access patterns. We add data to the end file and have aggressive write-behind strategies. When we read data, Redpanda reads in order, which means we can in theory have perfect read-ahead and object materialization that sits above the byte array style API of the page cache, etc.
More fundamentally, bypassing the kernel's page cache allows us to be predictable, with respect to both failure semantics and tail latency. We can detect and measure the rate and latency of I/O and adjust our buffer pools accordingly. We can react to low-memory pressure situations and have a holistic view of our memory footprint. We have predictability over each filesystem operation that can actually affect correctness - as recently evidenced by the PostgreSQL team with an fsync() bug that was undetected for 20 years.
The general-purpose heuristics are a lifetime of heuristics aggregated by programmers over decades of experience with production systems for doing I/O that permeates almost every layer of the kernel. In addition to bypassing the page cache, Redpanda comes with a bundled in auto tuner, rpk, that turns your regular Linux box into an appliance by:
/sys/block/\*, disabling expensive checks, but more importantly, giving Redpanda deterministic memory footprint during I/O.These settings are especially useful in NVMe SSD devices that can have up to 64K queues and each queue up to 64K slots. However, while these settings do provide anywhere from 10-30% improvement, the material improvements come from our architecture.
First, our adaptive fallocation amortizes file metadata contention in the Linux kernel (global operation for updating the size). Reducing metadata contention by debouncing file size updates gives Redpanda a 20%+ performance improvement on tail latencies when nearing disk ops saturation. Instead of mutating a global object with every file write, we simply tell the kernel to give us a few more chunks of data and associate them with a particular file descriptor because we know that we are about to write them. So now when we append data to our log, there is no global metadata update.
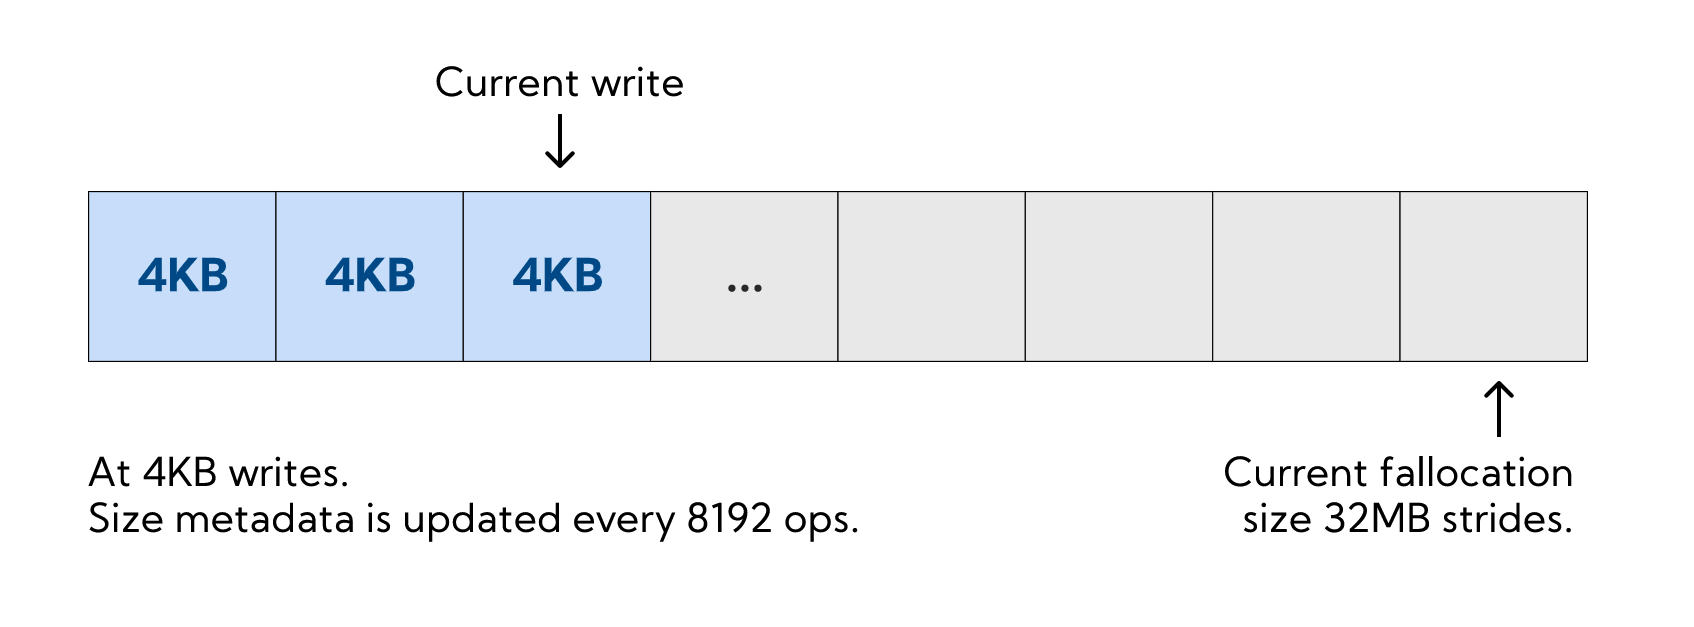
  if (next_committed_offset() + n > _fallocation_offset) {
        return do_next_adaptive_fallocation().then(
          [this, buf, n] { return do_append(buf, n); });
}3) Out-of-order DMA writesAs we’ve written before, our log segment writers use Direct Memory Access (DMA) which means that we manually align memory according to the layout of the filesystem and spend a great deal of effort ensuring that we flush as little as we can to the actual physical device, and instead try to spend as much time as possible doing dma_write() to reduce serialization points.
While streaming reads from the append_entries() Raft RPC, we continuously dispatch the current buffer out of a pool of allocated chunks with a thread-local buffer pool of filesystem-aligned buffers. This is a fundamental departure from the page cache, not only because we simply don’t use it but because we control exactly how much memory is allocated on a thread-local pool, and used as a shared resource between all the open file handles. This means that the most demanding partitions are allowed to borrow the most number of buffers in case of spikes.

This technique was really inspired by instruction pipelining techniques. To us mere mortals, the hardware guys have figured things out and when possible, we borrow pages from their book :) When decoding a set of operations for Raft, we artificially debounce the writes for a couple of milliseconds. This allows us to skip many fdatasync() operations, saving us not only from using fewer IOPS but from introducing global barriers on the file - flushes prevent any other writes in the background as fsync() is a point of synchronization.

Pipelining, batching, write-behind, out-of-order execution, and kernel tuning are the foundations for the material performance gains in the context of a thread-per-core architecture in Redpanda.
We haven’t even scratched the surface on our deep on-disk read-ahead strategies, write-behind buffering, fragmented-buffer parsing, integer decoding, streaming compressors, impact of cache-friendly look-up structures, etc.
We have given a brief exposé of the fundamental techniques to leverage modern hardware Redpanda uses. If you want a live chat, please join our Slack Community and say hi.
We empirically show that it is impossible to deliver on a 3rd of the workloads that exceed 300MB/s of sustained load on i3en.2xlarge instances in AWS. We ran the 500MB/s and 1GB/s workloads 4 different times on the original i3en.2xlarge instances as specified by the original set of benchmarks, with the original settings produced by Confluent, and we were unable to produce more than 300MB/s consistently. It is impossible to achieve a steady state of anything above 300MB/s not because of any software limitation but because the underlying AWS fabric caps you at around 300MB/s on these instance types.
We increased the workloads benchmark times because we could not get latency stability below 30 minutes warm up with Kafka and we wanted to showcase only steady state performance for both systems.

For smaller test duration, we show that you can achieve the 1GB/s throughput as stated on the original benchmarks with a dramatic cliff drop to 300MB/s.

Additionally, and as mentioned in passing on the introduction, we were not able to saturate higher boxes with the default number of I/O threads (8). We ran these benchmarks for 100 hours with 8 threads and we were reliably unable to saturate at the 1GB/s and 1.25GB/s throughputs. We had to increase the number of threads to 16 which caused Kafka’s average latency to increase a little bit, but we finally managed to get Kafka to saturate the hardware in most cases for throughput. Please see the interactive charts below.
The last significant change on the open-messaging benchmarks was to increase the number of consumers and producers to 16 which technically quadruples the original number of 4. We could not reliably produce and consume enough data from the benchmarks otherwise. 16 was the magic number that allowed us to get steady-state performance on the client-side.

How we revamped our Redleader agent to enable governed, multi-agent AI for the enterprise

47% lower latencies using 15% less CPU means better performance for intensive workloads

How a governed data control plane ensures trust and accountability
Subscribe to our VIP (very important panda) mailing list to pounce on the latest blogs, surprise announcements, and community events!
Opt out anytime.