
Full CDC semantics land in the Iceberg output for Redpanda Connect
Your lakehouse mirrors the database, instantly.
Learn how you can combine the power of Materialize and Redpanda to create a Fitbit-style activity-tracking application.


The data generated by Internet of Things (IoT) devices are considered big data. Collecting and processing IoT data has been challenging due to the classic “3Vs” of big data: volume, velocity, and veracity, imposing IoT analytics systems to acquire sophisticated data storage and processing infrastructure.
When considering tools for processing IoT data in real-time, a good combination to use together is Redpanda and Materialize. Redpanda is a data streaming platform API-compatible with the Apache Kafka® ecosystem. It is purpose-built to deliver speed, accuracy, and safety for streaming data. It enables ingesting large volumes of IoT data at high throughputs, and provides scalable and fault-tolerant storage. Materialize is a streaming database that can ingest real-time data streams from Redpanda and make them queryable within seconds, allowing developers to run online analytical processing (OLAP) queries on them.
By combining Redpanda and Materialize, developers can build real-time applications that ingest and process IoT data at scale. This includes use cases like real-time dashboards, anomaly detection, and event-driven microservices.
While we will be discussing Materialize, Redpanda, and Fitbit data in this blog’s use case, it’s also worth noting that similar IoT streaming applications can be created using these tools with Apache Pinot®, FastAPI, and Raspberry Pi.
Imagine that an organization wants to run a daily challenge based on the number of calories burnt by users and give out daily rewards to the top three fitness enthusiasts on the leaderboard. Since users can work out at any time, data coming in through any user’s Fitbit tracker has to be processed immediately so that the leaderboard is updated in real-time. By using Redpanda and Materialize together in our app stack, we can get real-time views of the data to share with users.
In this tutorial, we’re using a sample Fitbit tracker app to stream source data with Redpanda and feed it into in-memory views using Materialize. (This scenario is for demonstration purposes only and may not necessarily reflect a typical use case.)
Let us now look at the prerequisites to get started.
You can find the code to build the demo Fitbit activity tracker app in this GitHub repository. Please follow the README instructions to get the code up and running in your environment.
You can download Redpanda’s binary from GitHub here. In this document, we will be running in a Linux (Ubuntu20) environment. To see other installation options, view the documentation here.
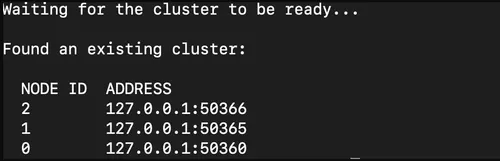
Note: If you are running in a Mac/Docker environment, please note down the IP addresses of the brokers, which you can find after the installation. It will be similar to the image below.
Since Materialize uses psql as its CLI, you need to install PostgreSQL.
Download and set up Materialize.
To generate data and simulate our data streams, we will use Python. For this, we require a Kafka library to push the data onto our topics. The Kafka library supports only Python version >=3.7.
The schema we are using is that of a Fitbit activity tracker. In Redpanda, data is read from multiple sources and then organized into topics. We will use two topics for this example.
The first one is called fitbit_activity_tracker, which shows the various activities generated on a given day in 2022. It records the steps, date, calories burnt, active minutes, and sedentary minutes. Apart from this, it also includes a couple of id fields called owner_id and activity_id.
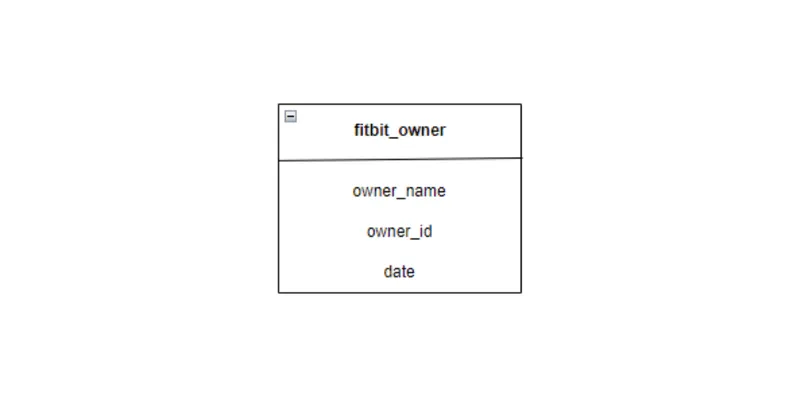
The second topic, called fitbit_owner, has the owner's name along with the owner_id and date. The values of owner_id and date between the two topics are the same, forming a pseudo foreign key relationship between the pair. Here is a simple schema diagram of the topics:
The producer logic for our application can be found in the redpanda_producer.py file. Running the producer code will accomplish the following :
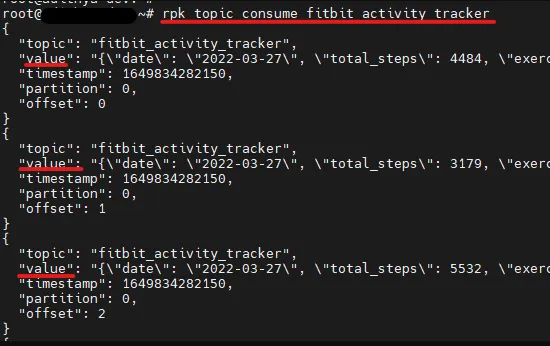
fitbit_activity_tracker and fitbit_ownerfitbit_owner and one to five entries to fitbit_activity_tracker every 0.5 seconds. The insertion goes on until there are 100000 entries to fitbit_ownerOnce the script runs successfully, you should see messages produced on the topics. You can also check the output of the individual producers using Redpanda’s CLI tool, rpk. Run the following command:
rpk topic consume fitbit_activity_tracker
Note: If you are running Redpanda in a Mac/Docker environment, you will need to tweak the command by adding the --brokers flag. So the new command would be:
rpk topic consume fitbit_activity_tracker --brokers <IP:PORT>
You will see the output below. The data inserted by the script will be under the value field of each message.
We can view the data in the other topic by running:
rpk topic consume fitbit_owner
Now that we have set up our data streams, let’s bring Materialize into the picture.
To start using Materialize, we will need to create a couple of Materialize sources from the topics. Sources are data connections that you want Materialize to consume. In this scenario, we would want Materialize to point to the topics that are continuously generating input/output. Before running any Materialize-related commands, we must first log in to the instance running Materialize. To do that, run this command:
psql -U materialize -h localhost -p 6875 materialize
After logging into the instance, we can create the sources.
Command to create a source on the topic fitbit_activity_tracker:
CREATE source fitbit_activity_src
FROM kafka broker '<YOUR BROKER HOST:PORT>'
topic 'fitbit_activity_tracker'
format text;
Command to create a source on the topic fitbit_owner:
CREATE source fitbit_owner_src
FROM kafka broker '<YOUR BROKER HOST:PORT>'
topic 'fitbit_owner'
format text;
You should see the following once the execution is successful:

Next, we create two views for each topic. A view represents a query you want to run. It also shortens lengthy queries, which can be cumbersome to enter multiple times.
Here we will create two views, with each acting as a representation for all the columns in the topics. Since we push entries in JSON format, we will decode each key and store it as a column. To create the views, run the following commands:
CREATE VIEW fitbit_activity_view AS
SELECT ((text::jsonb)->>'date')::          date    AS date,
       ((text::jsonb)->>'total_steps')::   int     AS total_steps,
       ((text::jsonb)->>'exercise')::      varchar AS exercise,
       ((text::jsonb)->>'calories_burnt')::int     AS calories_burnt,
       ((text::jsonb)->>'active_mins')::   int     AS active_mins,
       ((text::jsonb)->>'sedentary_mins')::int     AS sedentary_mins,
       ((text::jsonb)->>'owner_id')::int           AS owner_id,
       ((text::jsonb)->>'activity_id')::int        AS activity_id
FROM   fitbit_activity_src;
Then run:
CREATE VIEW fitbit_owner_view AS
SELECT ((text::jsonb)->>'owner_name')::   varchar AS owner_name,
       ((text::jsonb)->>'owner_id')::   int AS owner_id,
       ((text::jsonb)->>'date')::   date AS date
FROM   fitbit_owner_src;
You will see this once the execution is successful:

We can now create two materialized views based on the two normal views. Materialized views act as a traditional SQL view, but the difference is that, unlike a SQL view, it continuously updates the results of the internal SQL query. With the help of materialized views, we can get real-time updates on the new data from memory, thus giving the output at incredibly low latencies. You can even perform more complex operations such as joins, aggregation, etc., at these speeds
We will now create a couple of materialized views.
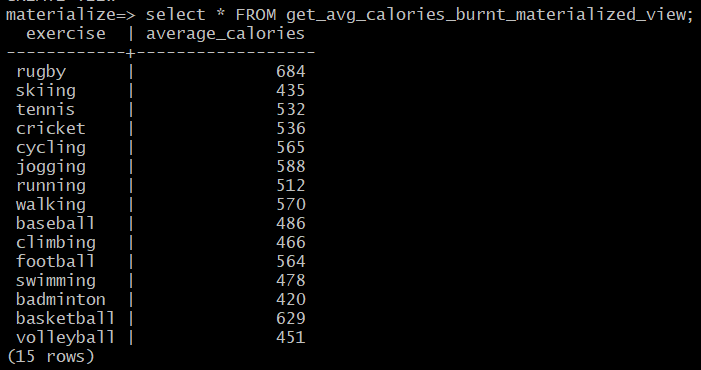
A view to calculate the average calories burnt per exercise get_avg_calories_burnt_materialized_view:
CREATE materialized VIEW get_avg_calories_burnt_materialized_view AS
SELECT exercise,
         Avg(calories_burnt):: numeric(10, 0) AS average_calories
FROM     fitbit_activity_view
GROUP BY exercise;
To check the results run:
SELECT *
FROM   get_avg_calories_burnt_materialized_view;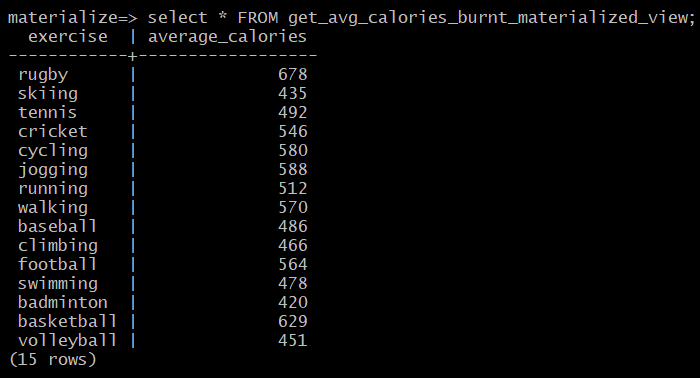
Since we are loading data every 0.5 seconds, we get different values if we wait for some time and rerun the query.
An alternative to this would be using a command with which you can get the sequence of updates affecting the results over time. For this, we can use the command below:
COPY (TAIL get_avg_calories_burnt_materialized_view) TO stdout;
COPY (TAIL get_avg_calories_burnt_materialized_view) TO stdout;
This command gives a continuous stream of updates on the view. To exit the stream, hit CTRL + C.
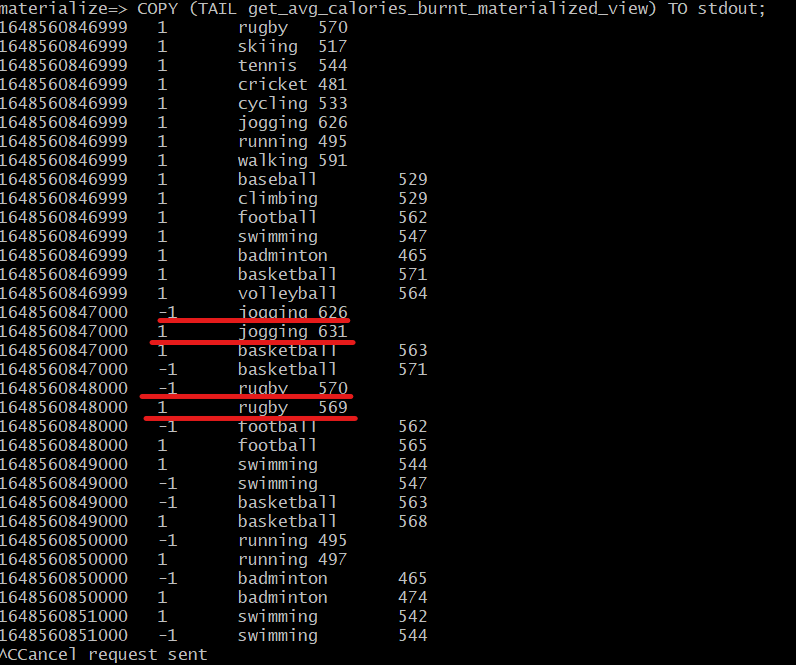
As you can see from the above output, the -1 column entry indicates a change in the value.
A view to calculate the joggers exceeding 9500 steps: get_total_steps_of_each_owner
Materialize supports all types of SQL joins expected from a traditional relational database. For this view, we will utilize that. The following command is the view:
CREATE materialized VIEW get_total_steps_of_each_owner AS
SELECT s.owner_name       AS owner,
       d.date        AS DATE,
       d.total_steps AS steps
FROM   fitbit_activity_view d
JOIN   fitbit_owner_view s
ON     s.owner_id = d.owner_id
AND    d.total_steps > 9500
AND    d.exercise='jogging';
This view gives a list of fitbit_owners who have jogged and have accumulated steps greater than 9500.
To view the output of this view, run :
SELECT *
FROM   get_total_steps_of_each_owner;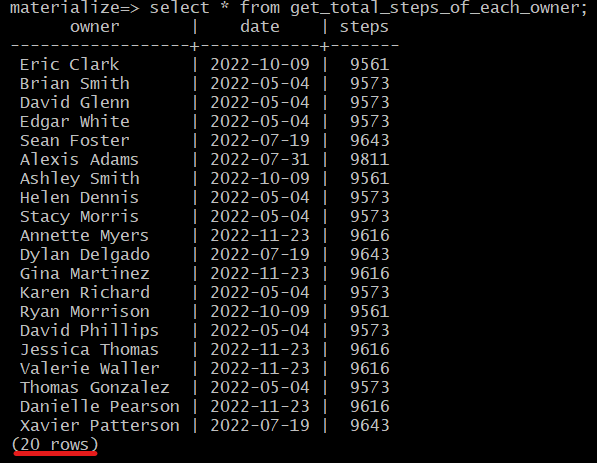
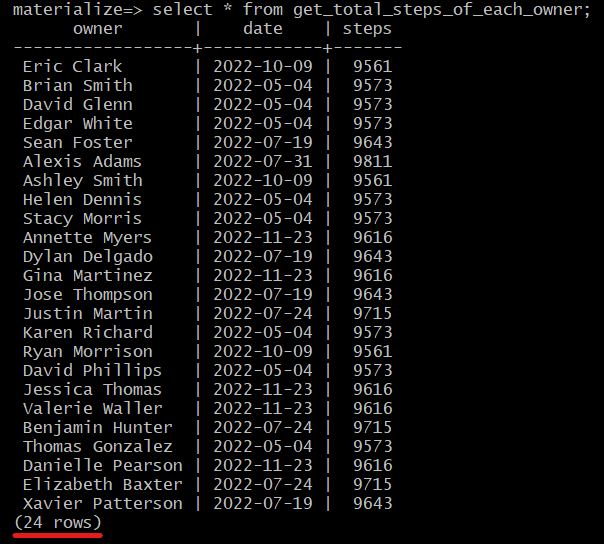
Again, running the same query after some time, we can see a change in the values.
Redpanda's integration with Materialize allows real-time insights into your data streams. Typically, a dashboard is used to visualize data and you can use a business intelligence tool like Metabase or any other Postgres wire-compatible tool. You can find more detailed information on the supported tools and integrations in Materialize’s supported tools documentation.
In today's tutorial, we focused on health tracking, but the underlying technologies discussed in this article can be used to build real-time dashboards across industrial automation, financial services, and e-commerce industries to provide faster, more powerful, and cost-effective real-time analytics.
As a reminder, you can access the sample code for this tutorial at any time in this GitHub repo. If you have questions about using Redpanda and Materialize together, join the Redpanda Community Slack to ask them. Read these other integration tutorials to learn more about building your own data streaming applications.
Subscribe to our VIP (very important panda) mailing list to pounce on the latest blogs, surprise announcements, and community events!
Opt out anytime.