Drag, drop, done: a visual composer for Redpanda Connect
Boxes and arrows for people who move billions of events a day. No per-row invoice required.

Learn what makes Redpanda Console the best UI for managing Apache Kafka environments.


Redpanda Console offers features that are useful for debugging. It allows you to view messages from every partition and filter the data stream for just what you want to see. You can filter for all records that match a particular timestamp, user id, key, or range of values within the message headers or the value. You can view all of the consumers in a consumer group, and if you stop the consumer group, you can roll back offsets for the entire group and have them start at an earlier place in the log. This makes it easy to replay logs in any situation where you might need to process the data again.
Redpanda Console provides an easy, intuitive interface for configuring ACLs, making it simpler to secure your cluster. You can configure ACLs for each principal for topics, consumer groups, and the entire cluster. It also allows you to view and edit any existing ACL, presenting the information in a way that makes it instantly clear what a principal is authorized to do. The ACL information carries over to the Topics and Consumer Groups tabs, providing easy access to the resource authorization levels.
Programmable Push Filters (PPFs) in the Redpanda Console are written in TypeScript and are sent to the server to act on the data before it’s sent to your browser. This feature helps in finding specific data by reducing the amount of data that needs to be processed. PPFs are configured on the client side, but by executing them on the server, Redpanda Console stays snappy and responsive, no matter how much data you’re filtering.
Redpanda Console is a tool built on the foundations of Kowl, designed to improve the experience of interacting with data clusters. It works with Redpanda, Apache Kafka, and anything else that uses the Kafka API. The console provides the tools and insights needed to interact with your clusters in a more manageable and pleasant way. It allows you to create topics, browse their contents, consume and produce messages, explore the topology and configuration of your brokers and topics, and see information like the topic size and how much space it uses on each of the brokers. It also allows you to perform CRUD tasks on ACLs.
What’s something that people universally dislike about the Apache KafkaⓇ development experience?
The command-line tools.
I know firsthand how difficult they can be, which is why when Redpanda acquired CloudHut in April 2022, I was immediately fired up about what that meant for the future.
For several years, during the rise of Kubernetes (that sounds like the title of a B action movie), I worked at Rancher, and I witnessed firsthand how a GUI can take a complex piece of software and turn it into a manageable experience.
Despite being relatively straightforward to use with your applications, tools like Redpanda and Kafka can be daunting when you need to quickly examine or interact with the data they contain from an operations aspect. The information that you need to extract is in there, but the tools to extract it are over here, and over there, and in that drawer, and behind that cabinet…
Redpanda Keeper (rpk) is light years ahead of the Kafka command-line utilities, but it’s still challenging for debugging or for simple tasks like producing multi-line records.
It feels like there should just be an easier way to do it, and now there is.
It’s called Redpanda Console.
It’s built on the foundations of Kowl, and it works with Redpanda and Apache Kafka (and anything else that uses the Kafka API).
It gives you the insight and tools you need to interact with your clusters in a way that’s…dare I say…pleasant?
We’ve all been in a situation where something’s wrong, and you need to figure out why or what happened.
You need to do it quickly, and you have almost no information to start with.
You might only have the result of the problem, or maybe all you know is something happened, and something broke.
You need a root cause.
You start to work your way backwards, looking for a corrupted record or a partition that’s not balanced… something that will give you a clue where things started to fall apart.
Using multiple tools to find the information only slows you down, and let’s admit it: humans aren’t very good at processing volumes of text output in a terminal.
We’re much better at processing structured visual data that our brains can classify as relevant or not to what we’re looking for.
That’s why we started using GUIs in the first place, right?
Redpanda Console solves problems for both developers and administrators (or for the lucky few who wear both hats).
You can create topics and browse their contents, consume and produce messages, explore the topology and configuration of your brokers and topics, and see information like the topic size and how much space it uses on each of the brokers.
You can even perform CRUD tasks on ACLs, one of the most challenging and error-prone aspects of cluster administration.
If you’re using Redpanda, then Console also connects to the Redpanda Admin API to get more information about the cluster than is visible from the Kafka API.
It slices! It dices! It makes julienne fries!
There’s something in it for everyone, so let’s dive in.
There you are, on a different day, and someone in Fulfillment has asked you for all email addresses related to a particular customer ID in your online store.
You know that there are millions of records to sift through, but the request doesn't phase you.
You fire up Redpanda Console, jump over to the Topics tab, and click into your topic.
There you see all of the messages still being produced, and there are a lot of them.
On the Messages tab you set the start offset to “Oldest” and add a Programmable Push Filter (PPF) that limits the output to only the records for that customer’s email address.
You press Refresh, and suddenly your screen goes calm.
Only the relevant records are displayed.
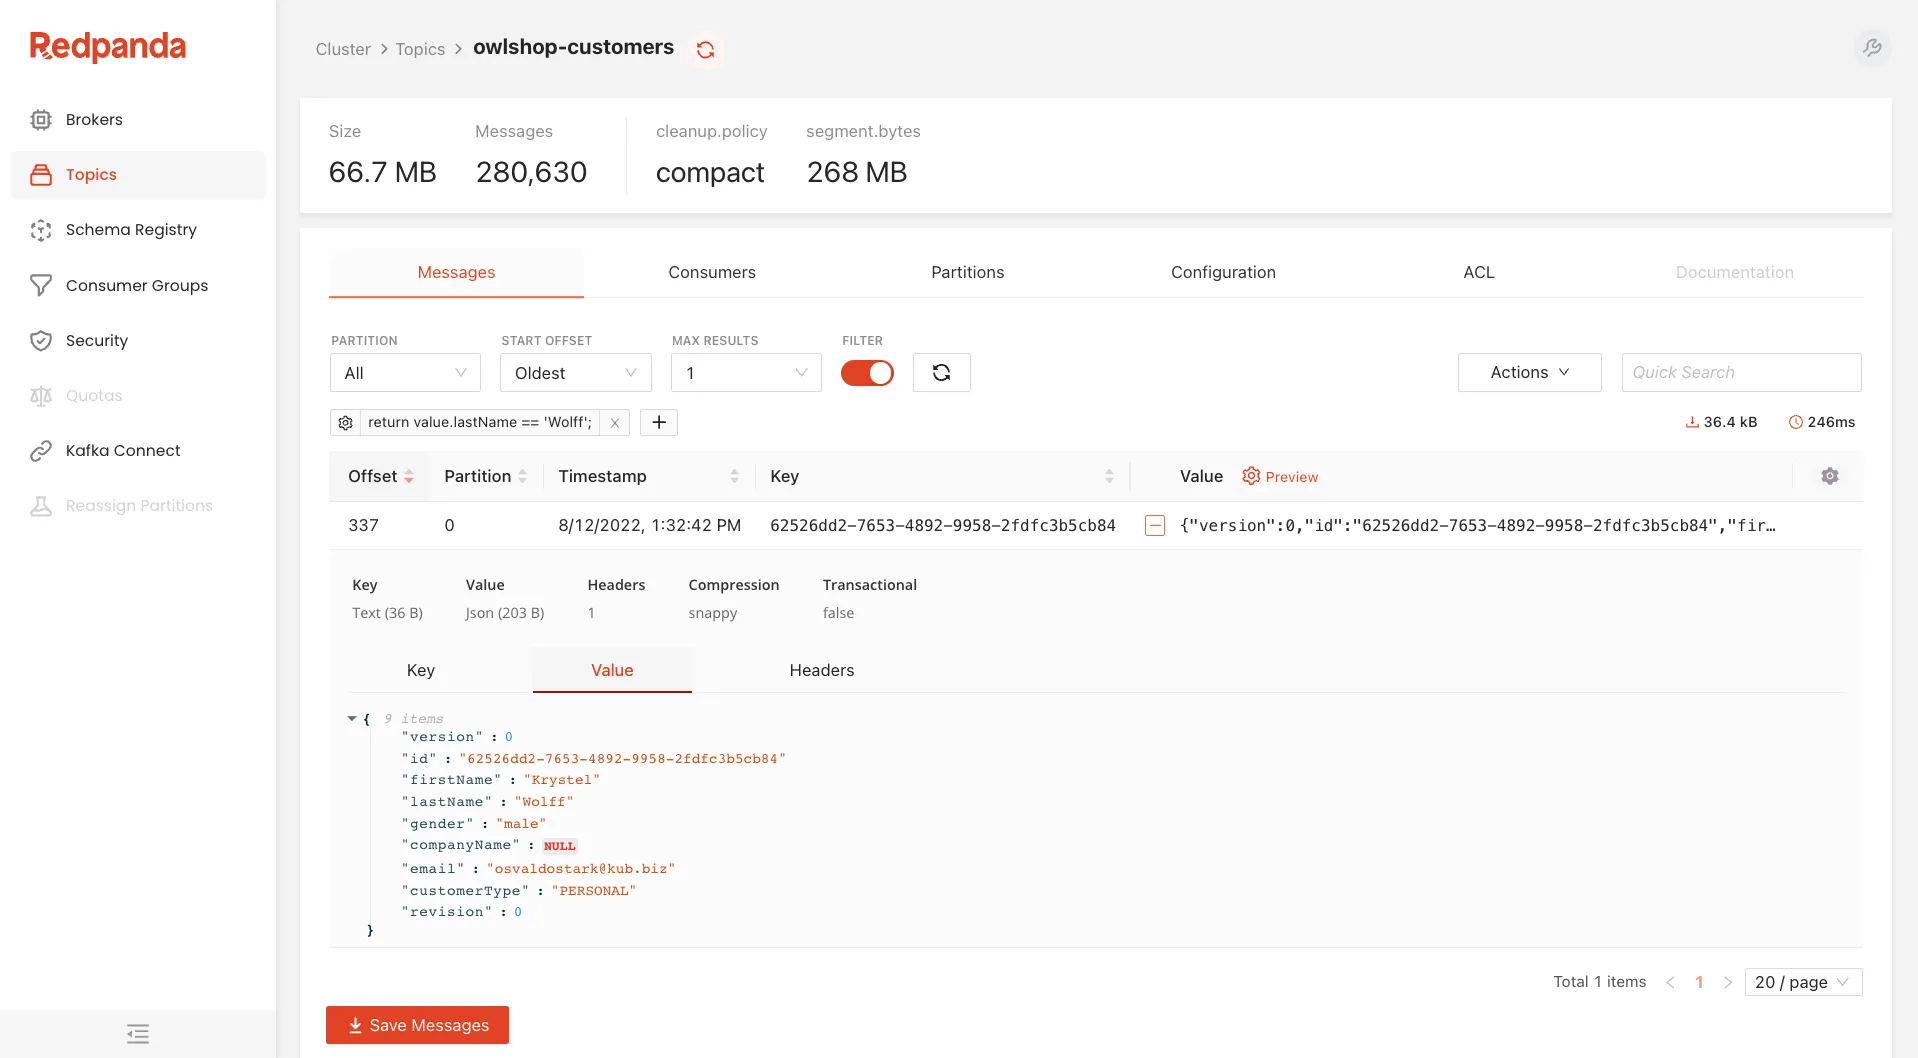
You gather up the information and send it to the Fulfillment department. Job done.
Or imagine the earlier scenario, where you were hunting for the root cause of a crash.
The consumer printed a stack trace that included the partition ID and offset, so you filter for that in Console.
You open the record that appears and examine the value, and right away you see the problem.
Somehow it has a value that can’t be parsed as JSON. It’s an edge case that’s not in your test suite, and the consumer can’t process it.
You quickly add the test to your application, code the handling, and ship it.
A few minutes later the updated image rolls out to your consumers, and messages start flowing again.
Perhaps instead of an ecommerce site your company processes IoT data. You can create a filter with a TypeScript function that’s more complex than just a comparison.
How complex?
That’s up to you.
Messages that result in a true result show up in Console.
It’s really that easy.
These simple examples highlight two of the features that are useful for debugging: viewing messages from every partition and filtering the data stream for just what you want to see.
You can do much more, like filtering for all records that match a particular timestamp, user id, key, or range of values within the message headers or the value.
You can view all of the consumers in a consumer group, and if you stop the consumer group, you can roll back offsets for the entire group and have them start at an earlier place in the log.
Assuming your consumers are idempotent (and why wouldn’t they be?), this makes it easy to replay logs in any situation where you might need to process the data again.
Unexpected data loss in a downstream component?
Check.
New processing workflow in the consumer?
Check.
Anything else you can think of?
We’ve probably got it, but if not, open an issue and ask for it.
The Programmable Push Filters are very cool.
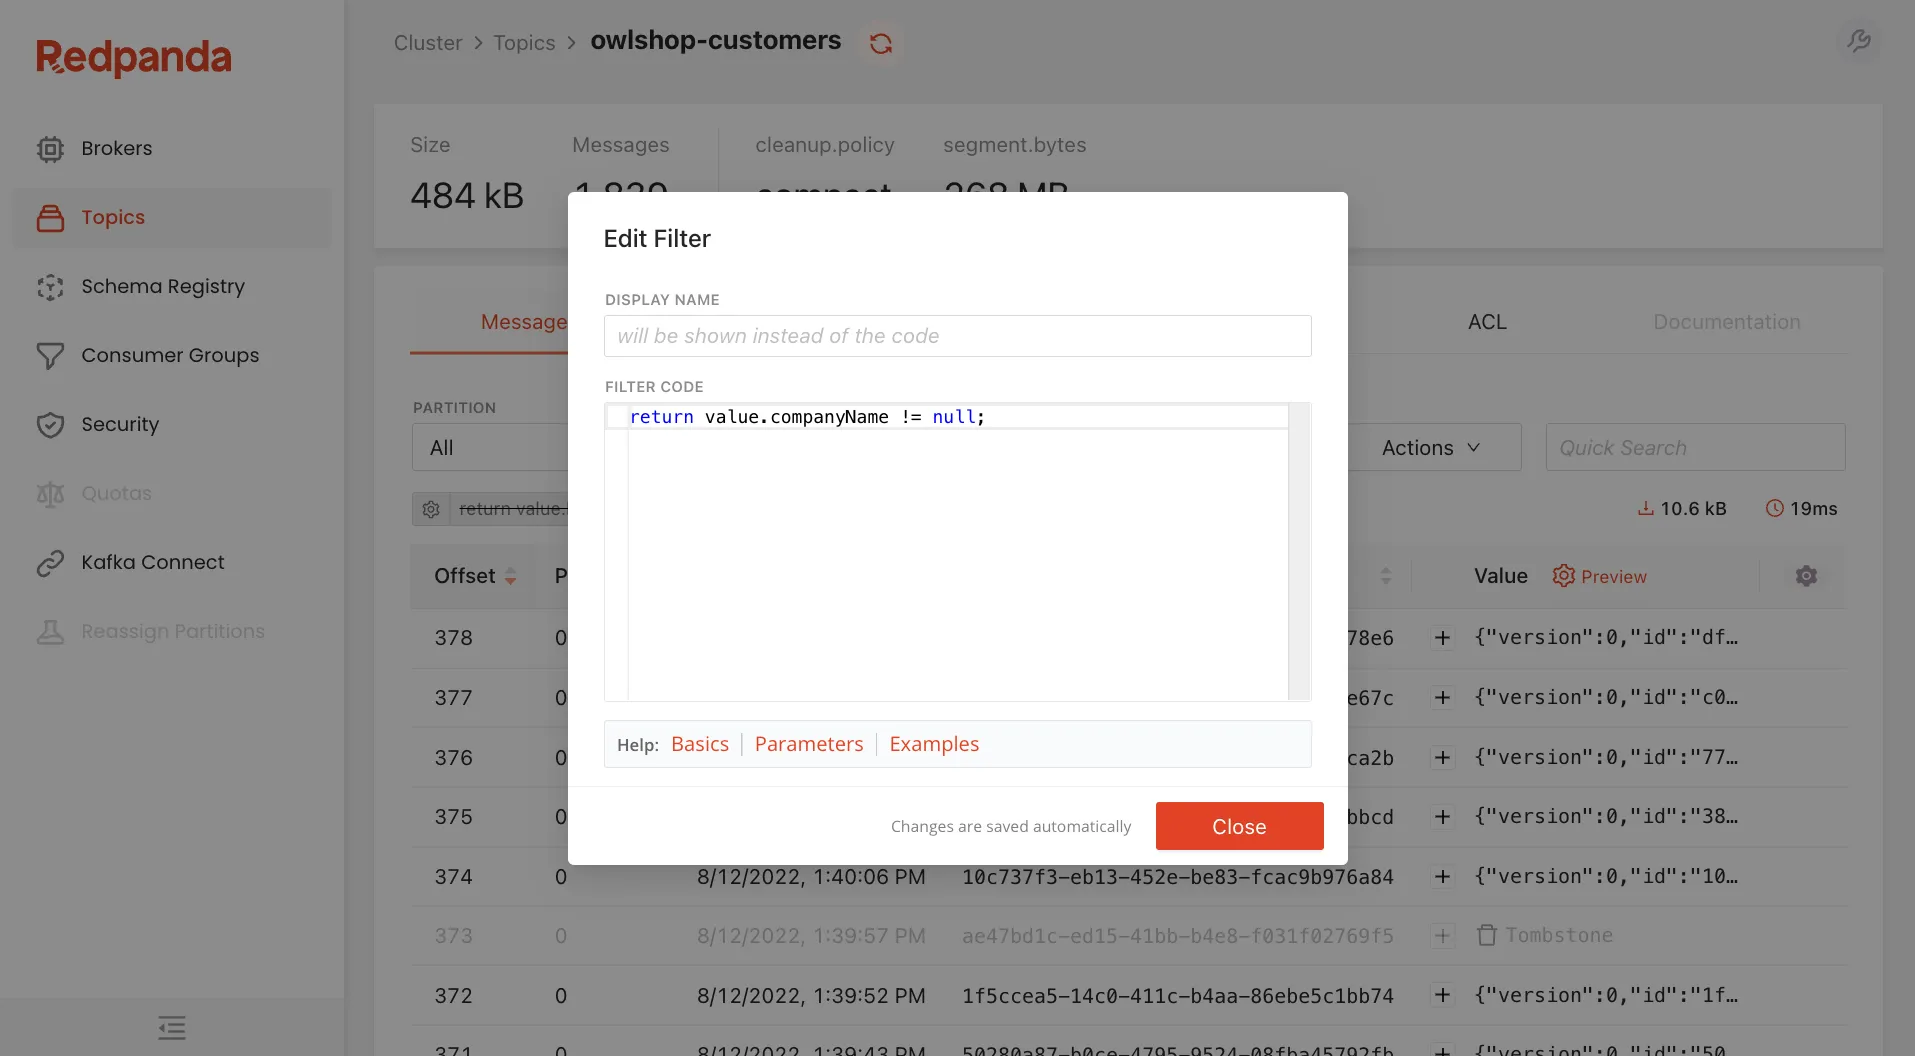
Written in TypeScript, these filters are sent to the server and act on the data before it’s sent to your browser.
It’s like finding a needle in a haystack by making the haystack smaller. If you’re looking at a topic with millions of records, you don’t want to send those across the Internet only to have the bulk of them discarded by a client-side filter.
We configure the filters on the client side, but by executing them on the server, Redpanda Console stays snappy and responsive, no matter how much data you’re filtering.
Martin Schneppenheim, one of the principal developers of Redpanda Console, is writing an article that goes into the debugging features of Redpanda Console in detail, so check back to read that when it comes out.
If there’s another thing in Kafka that’s harder than it should be, it’s configuring, visualizing, and understanding the scope of access control lists (ACLs).
ACLs are multiplicative, which means that if you have two principals (users) and two permissions, you’ll have four ACLs.
Adding more resources continues to increase the number of ACLs, and as they grow, the likelihood of error grows with them.
If you’re not careful, you might allow someone to perform an action that you don’t want them to perform, because one ACL denies them access that another ACL grants.
Redpanda Console has an easy, intuitive interface for configuring ACLs that makes it trivial to secure your cluster.
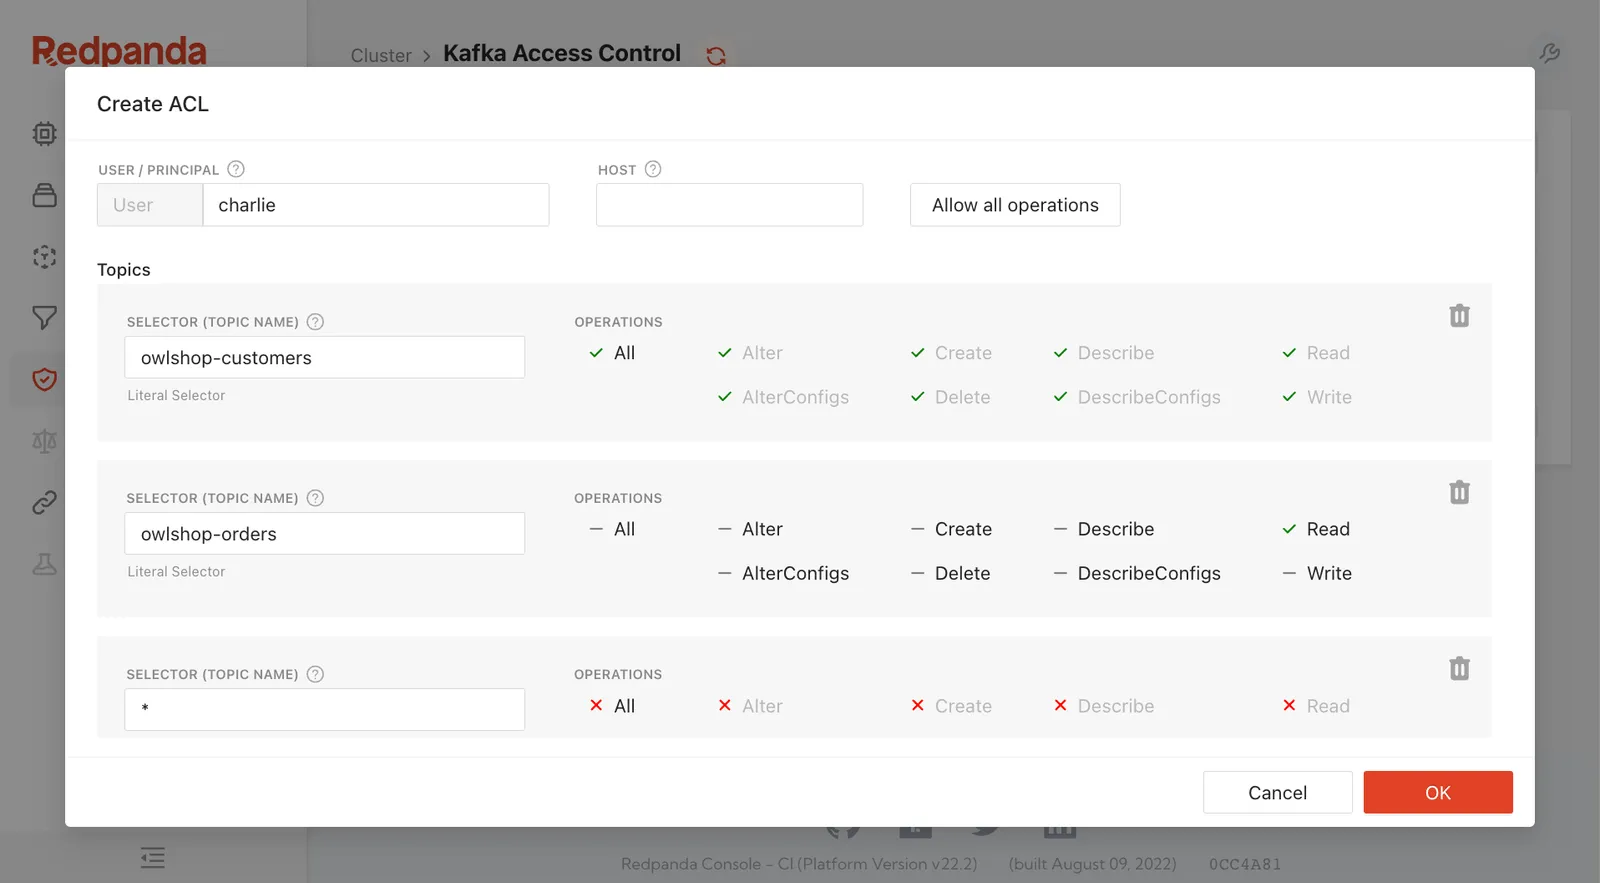
You can configure ACLs for each principal for topics, consumer groups, and the entire cluster.
It takes only a few seconds, and it’s really hard to screw it up.
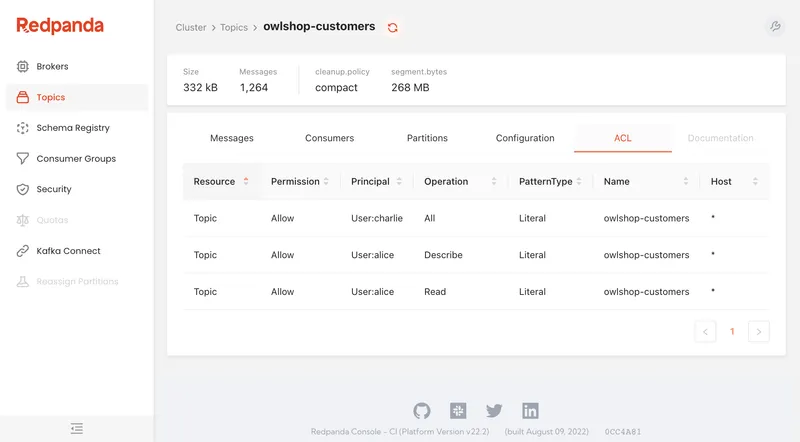
You can view and edit any existing ACL, and Console presents the information in a way that makes it instantly clear what a principal is authorized to do.
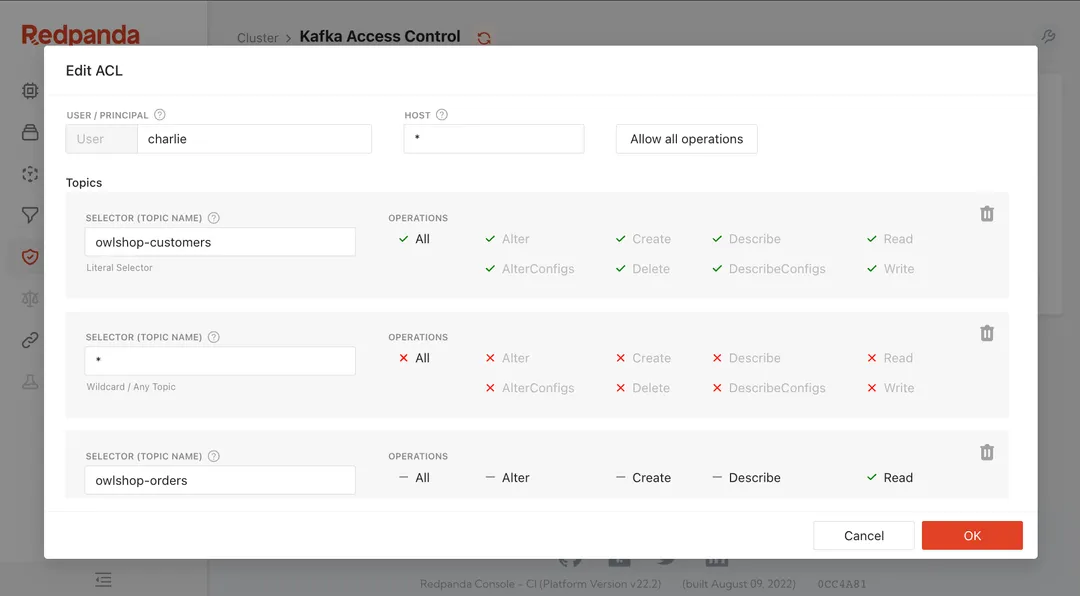
The ACL information carries over to the Topics and Consumer Groups tabs, so if you’re curious who has what level of access to the resource that you’re viewing, the information is right there on its own tab.
I’ll have an entire article coming out soon about how to use the ACLs feature in Redpanda Console, complete with examples on how to set up TLS and SASL/SCRAM.
Check back later for that.
When Redpanda Console is using an enterprise license, you can connect it with an identity provider (IDP) who supports OAuth and get all the benefits of single sign-on (SSO).
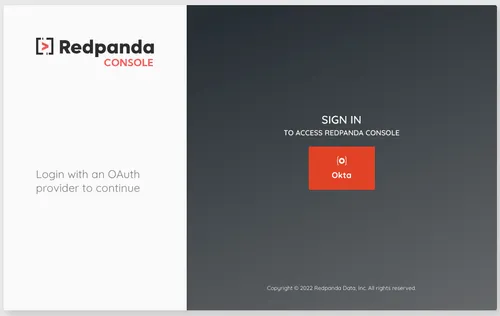
When you tie Console to an IDP, you not only get an easier login experience, but you also leverage the existing user accounts and groups in the external provider.
When someone needs access to Console, drop them into the group with authorization.
If someone leaves the company, you need only disable their account in the IDP, and they’ll lose access to Console along with everything else.
There’s no duplication of account data in multiple systems, and this means lower management overhead and less human error.
Who wants a data breach, right?
Along the left side of the interface you’ll find the tools for quickly interacting with your cluster.
If some are grayed out, it means that those features aren’t supported by your cluster. For example, Redpanda doesn’t support quotas or partition reassignment, but Kafka does.
We’ve already gone through the Security tab, so let’s look at the rest of them.
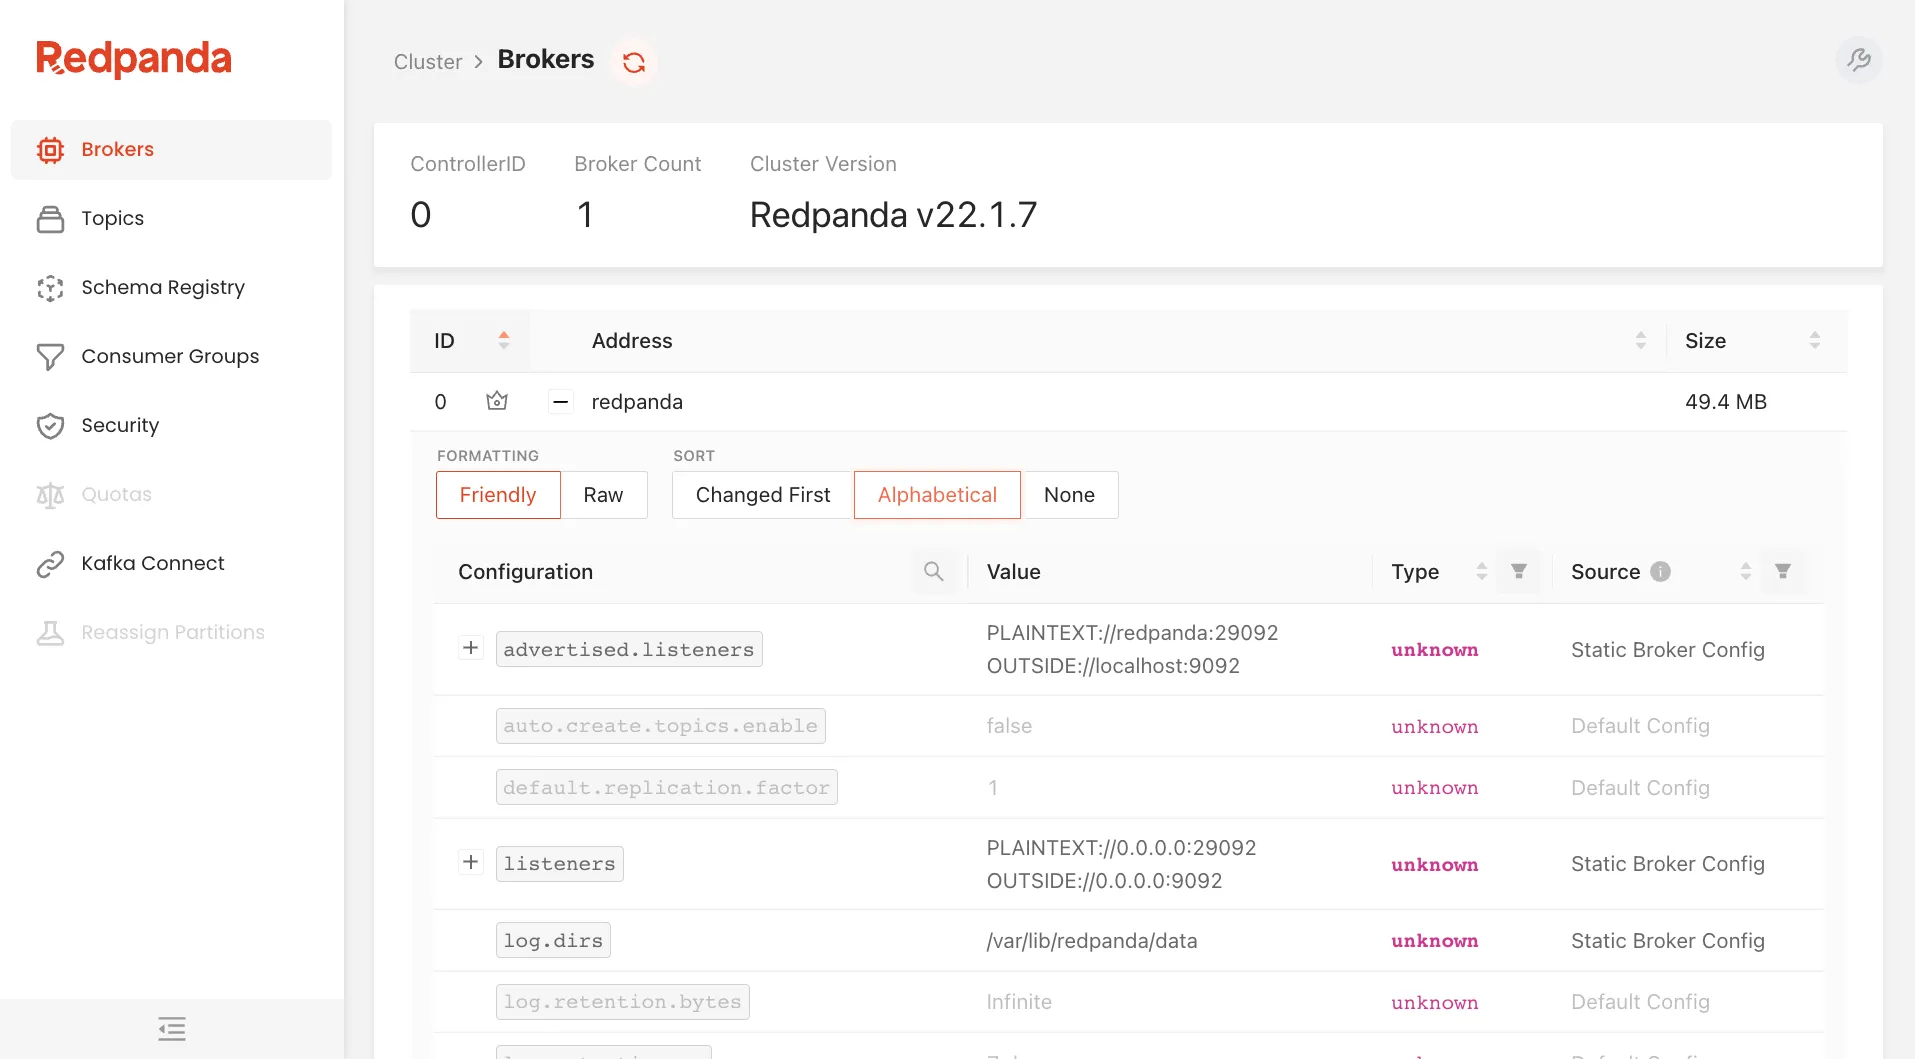
Within the Brokers section you can see the number of brokers, which broker acts as the Controller for the cluster, and the cluster version, along with the configuration for each broker and the amount of space being used by the topics and their data.
The configuration is read-only, but it makes it easy to see what’s what without having to use the command line.
The Topics section shows you the existing topics and information about them. From here you can create a new topic or click into an existing topic to interact with it.

Earlier in this article I showed you how to view a topic’s ACLs or create Programmable Push Filters to act on its messages.
Within the Topics section you can also view the consumers of a topic, its partitions and information about them, the topic configuration, and documentation about the topic.
Wait, documentation?
Our developers have all worked in large enterprises that depended on Kafka, where multiple teams used the same clusters, and where documentation about how a topic was used existed in one of a myriad of places (if it existed at all).
Redpanda Console simplifies that by associating itself with a Git repository.
If a Markdown file exists that matches the name of the topic, its contents are visible under the Documentation tab.
Now when someone wants to know who owns a topic or what it’s used for, they don’t have to search high and low for that information.
The Schema Registry section provides an overview of what schemas are available within the registry.
Users don’t have to leave Redpanda Console to find that information from another source.
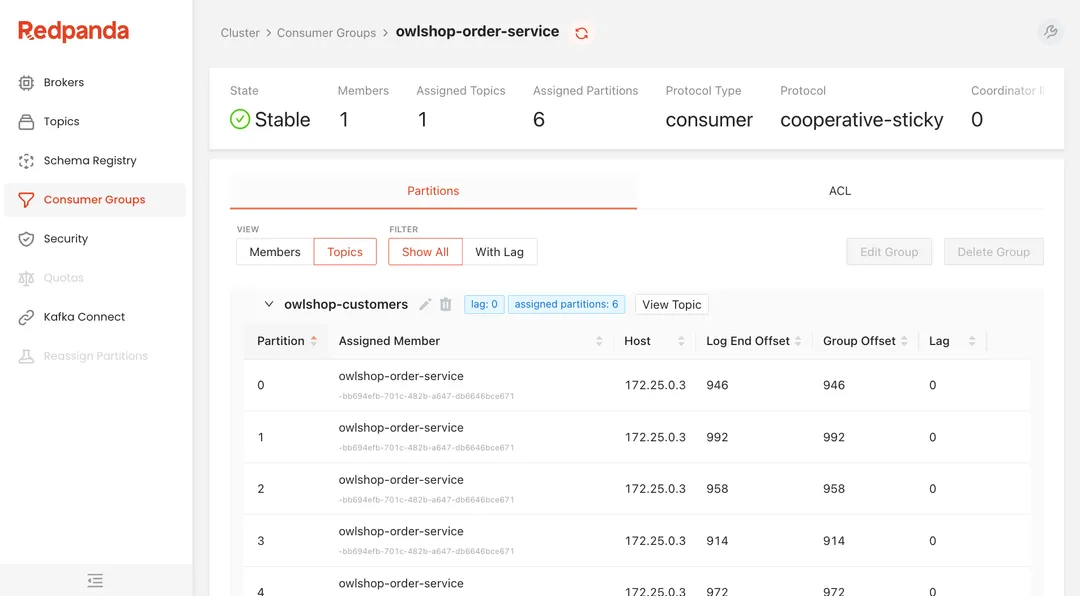
The Consumer Groups section shows what consumer groups are connected to the cluster, their configuration, and their status.
Drilling down into a consumer group shows which members are assigned to which partition and also gives information about the member like its address, offset, and lag.
Although not presented as its own metric, this page shows you in an instant if your group is keeping up with the message load.
If it’s not, then it’s time to scale.
There’s also an ACL tab that shows information about what principals are allowed to do with this consumer group.
Knowing who is consuming a topic tells you who to inform when there might be breaking changes in the producers.
(Without that information being readily accessible, you might only find out when you hear the yelling from the other side of the office. 🤬)
Within a consumer group there are two buttons that are disabled by default.
One is for editing group offsets, and the other is for deleting them.
These features aren’t available while the consumer group is active, but if you stop all of the consumers, you can perform actions like changing the start or end offset, setting all offsets to a specific timestamp, or copying offsets from another consumer group.
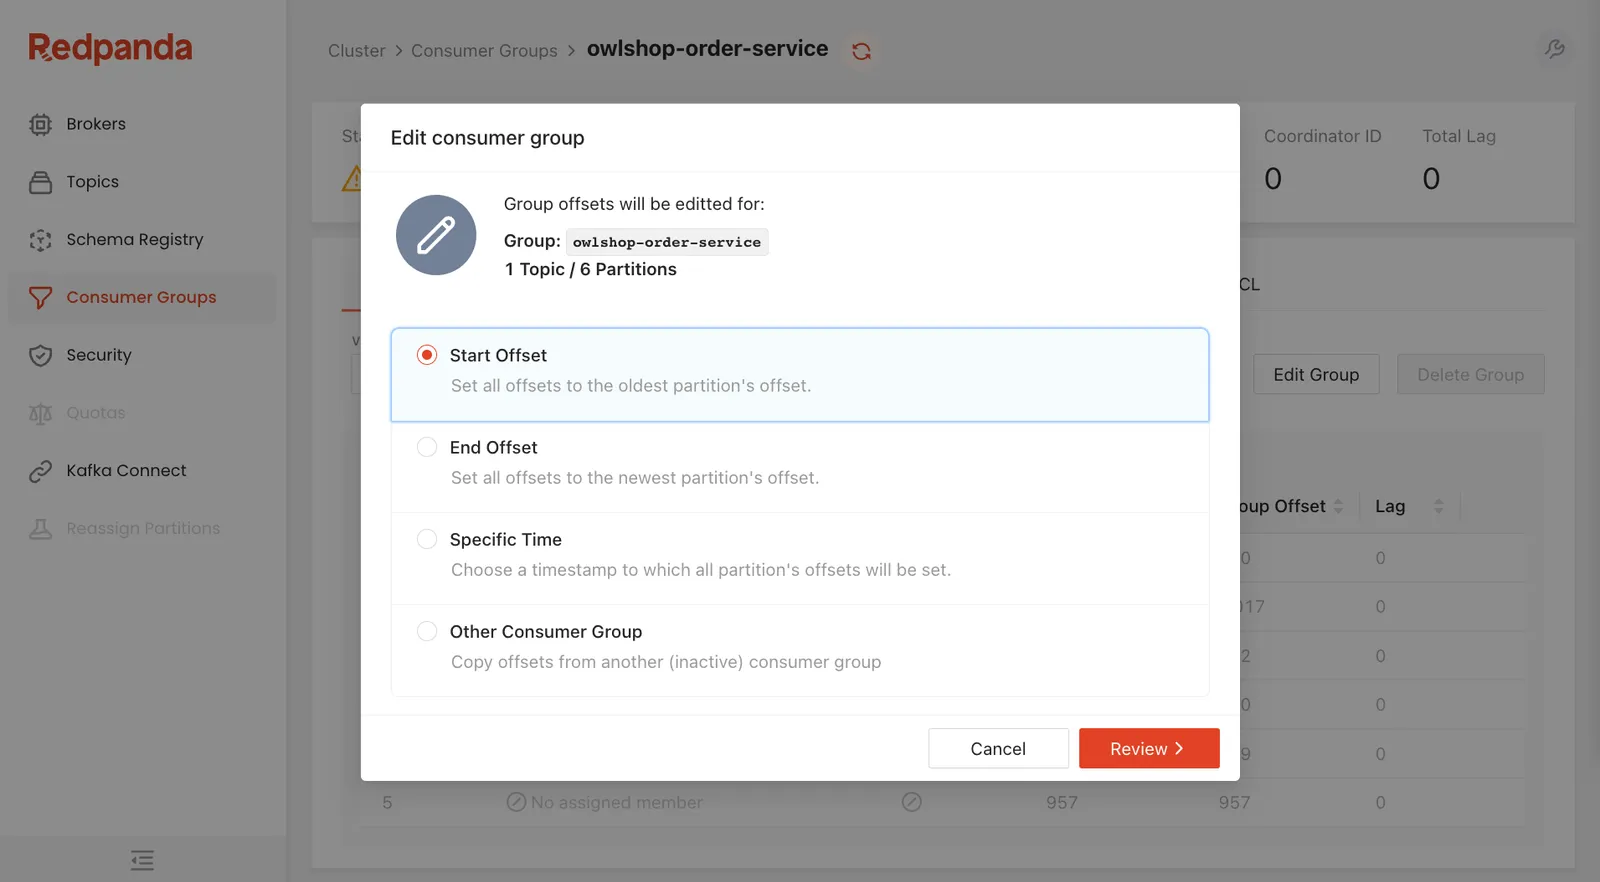
After making these changes, start the group back up, and they’ll begin processing messages from the offset that you configured.
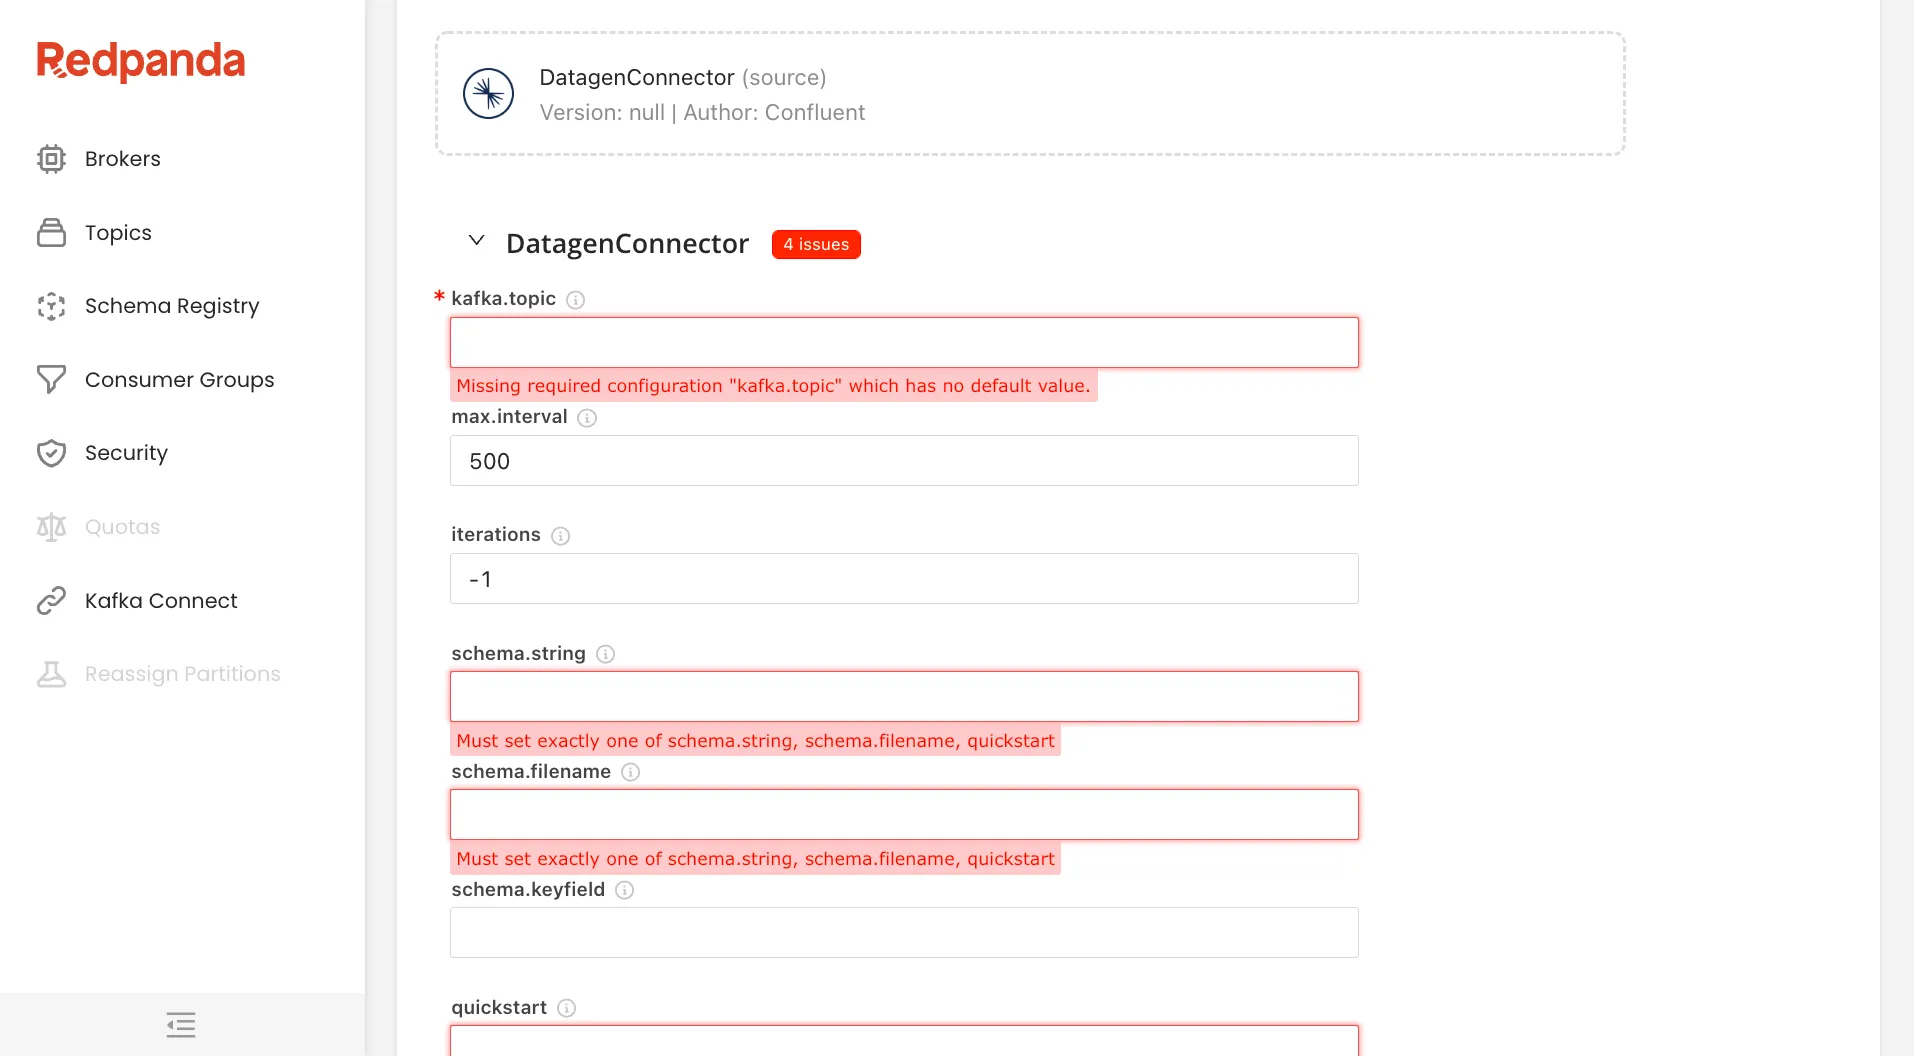
The last section shows you the Kafka Connect clusters that are attached to this Redpanda or Kafka cluster, their connectors, and any active tasks. Some enterprises have a different Kafka Connect cluster for each team, which makes it easy for them to manage the connectors their applications use.
From within Redpanda Console you can create new connectors for any of the clusters.
Once configured, those connectors will begin streaming data to and from the cluster according to their purpose.
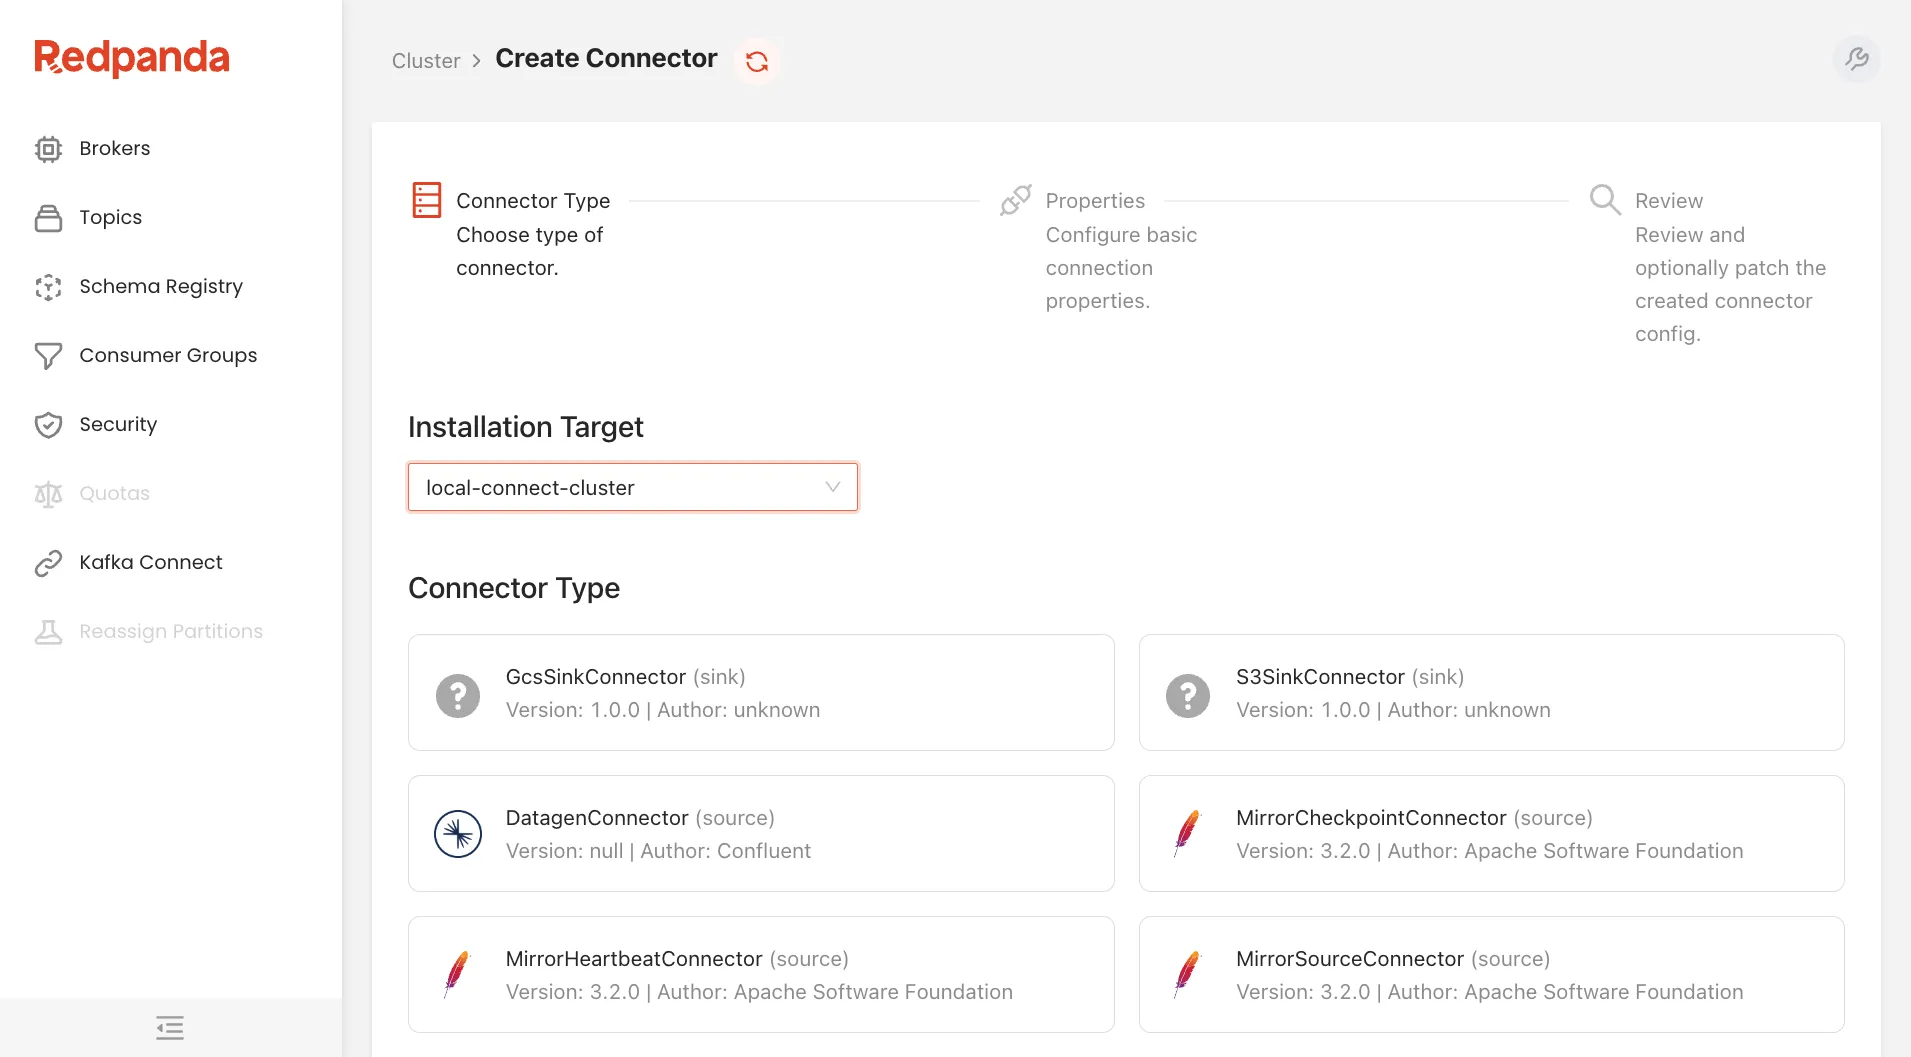
On the surface, this may seem like it’s not very magical, but don’t be fooled.
There’s magic here.
Behind the scenes Redpanda Console communicates with the Connect cluster, and using your chosen plugin’s self-describing API, it creates a form that shows you all of the fields, highlighting which are required and including the help for each of them.
Instead of reading boring documentation and resigning yourself to the frustration that comes from fumbling around in the dark, Console gives you a sleek, information-rich interface that almost guarantees your success.
Redpanda Console delivers a tremendous improvement in the productivity, effectiveness and quality of life of developers and operators who work with Redpanda or Kafka.
You can get started with it today by installing the latest release or pulling down a container image and firing it up.
We have documentation for it in our docs site, which references a Docker Compose file that you can use to quickly spin up a demonstration environment that contains a Redpanda cluster, an ecommerce shop that produces data to it, a Kafka Connect cluster, and Redpanda Console.
If you get stuck, you can open an issue, join our Slack community or start a discussion.
The best thing you can do is to help us spread the word about Redpanda and Redpanda Console.
Share this article on Twitter and LinkedIn and tag us @redpandadata when you do it.
We want to hear how people are using Redpanda Console and how it’s making your life easier.
Send us a picture from the beach! 🏖
Subscribe to our VIP (very important panda) mailing list to pounce on the latest blogs, surprise announcements, and community events!
Opt out anytime.