Using Redpanda with Apache Druid for Real-Time A/B Testing
How to integrate Redpanda with Apache Druid for real-time A/B testing.

Let’s say you have a new business strategy and want to attract more customers. You’ve decided to test several marketing options on your customer base to see which one most effectively reaches your audience. The result of this exercise should indicate the best practical option to implement in production. In a nutshell, this is how A/B testing works.
Here are some of the uses cases of A/B testing:
- Improve marketing strategies
- Improve the user experience
- Find an efficient way to display promotional or discount ads in apps/sites
- Run festive time campaigns to improve sales
Understanding A/B testing and how to implement it in real business sites or applications can be quite lucrative for your organization. Furthermore, knowing the practical ways to achieve relevant A/B testing techniques can make your life easier and save you from spending weeks creating and executing a strategy.
While there are many benefits of A/B testing, its time-consuming and error-prone nature can hinder organizations due to the highly competitive market in the technology era. At this point, real-time A/B testing comes in as a savior.
This article first explores real-time A/B testing and then demonstrates how you can achieve it using Redpanda with Apache Druid.
What Is Real-Time A/B Testing?
An A/B test compares two options for a single strategic marketing asset, such as a web page design for displaying discount information. You have to expose the two options to different segments of your customers for comparison. Based on a customer-attraction metric, sales metrics from the targeted segments, or other metrics, you can statistically know which of the two options worked better for your business. Carrying out such an exercise in real-time can provide immediate information about which strategy is working best, so that the system can use this information and take action in real-time.
However, the scope of A/B testing isn't just this one exercise; only conducting a single A/B testing exercise will give you very limited comparison data that's relevant only for the customers exposed during that test. As time passes, you may have additional customers who have different expectations. You’ll need to carry out such tests on multiple occasions to keep improving your decision-making process, customer retention, and sales. Real-time A/B testing provides a better way to achieve these improvements by generating immediate, actionable results that minimize human error and offer a more efficient use of time.
A real-time A/B testing process helps you learn more about your customers and act immediately to identify new ways to convert new prospects into customers. In the subsequent sections, you will be introduced to key trending technologies that help you to implement real-time A/B testing in practice.
What Is Apache Druid?
Apache Druid is a high-performance, massively multi-tenant, streaming analytical database. High performance implies that Druid can serve queries at low latency. Druid works well with streaming data, which has become quite popular due to its real-time visibility applications, and is used in multiple organizations. Streaming data from Apache Kafka, AWS Kinesis, Azure Event Hubs, Redpanda, and similar streaming platforms can easily be ingested into Apache Druid. The data ingested into Druid is readily available and indexable for analytical querying purposes.
Apache Druid can perform fast analytical operations on large-scale data sets, such as counting, sorting, grouping, and time series analysis. Because of these capabilities, it is well suited for analytical purposes, as you can digest any data from any supported system. Thus, you can use your analytical dashboards or UI to provide operational visibility on a real-time basis.
How Are Druid and Redpanda Used for Real-Time A/B Testing?
Druid works best with event-oriented data such as telemetry, so it's a good choice for real-time A/B testing use cases. Further, Druid (an ideal choice as a streaming analytical database) and Redpanda (with its real-time data stream processing capabilities) naturally complement each other for effective A/B testing applications.
Consider a scenario where you would like to figure out how and where to display discount information on your site so that it best catches your customer's attention. A/B testing can be used to understand what kind of discount display options on the site would enable more sales; for example, you could display discount information on the home page for one segment of customers—say, customers in the US region—and display discount information in each categorical section of the website for another segment of customers—say, customers in the UK region.
When a customer sees the discount and clicks on it, a “telemetry” event is generated and streamed over to a Redpanda topic. This generated event needs to include some sort of metadata information indicating whether the discount information displayed was accessed in your application via the home page link or that of the categorical section. You can use this data to understand the effectiveness of your display options. This streaming data can then be ingested in real-time to the Druid database.
Similarly, when each customer accesses your products or site content through the discount ads displayed on your site, events are generated and processed into the Druid database in real time. You can then execute an aggregated or analytical query on the Druid database tables and use the previously mentioned metadata information to compare and understand the effect of promotional events displayed on your site. Moreover, you can use this data to change the A/B testing percentages in real-time and change how the future customers see the promotional events. This is where you actually use the “real-time” benefits of Redpanda and Apache Druid.
The rough architecture diagram for this scenario is as follows:
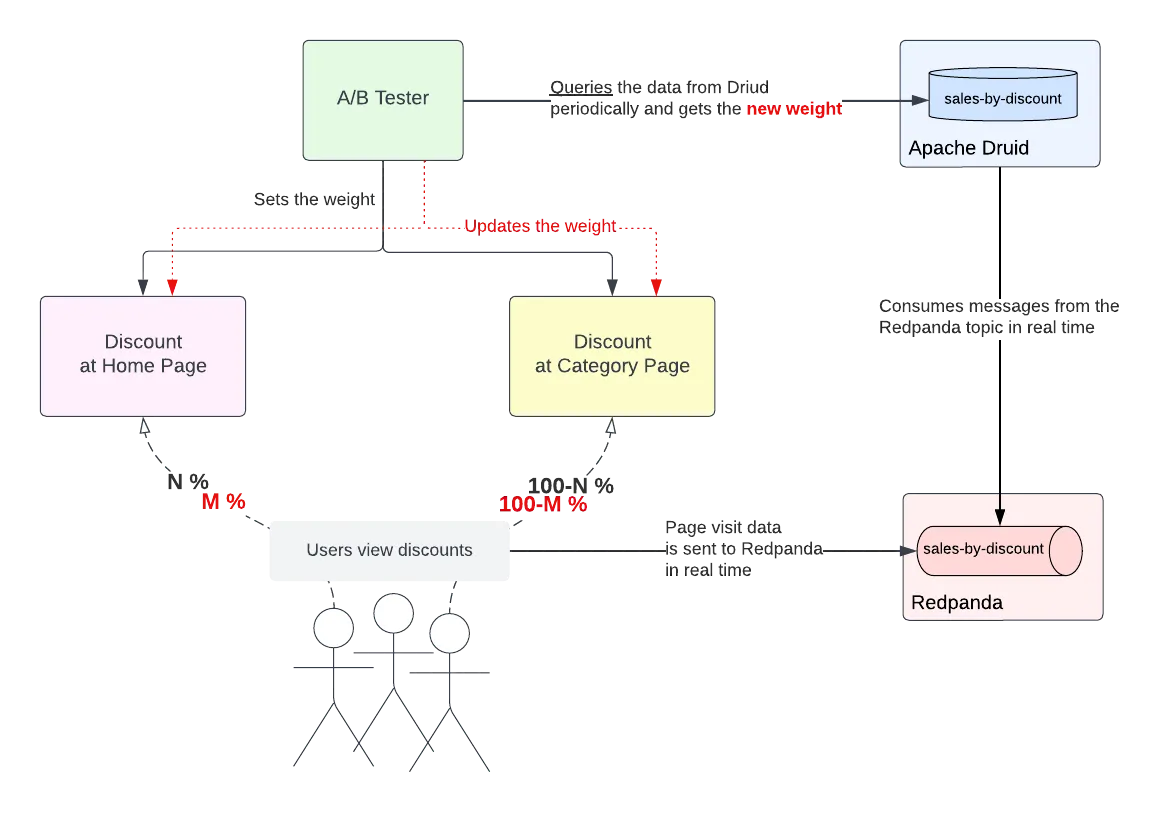
In the rest of this article, you’ll see real-time A/B testing with these technologies in action.
Implementing Redpanda with Apache Druid for Real-Time A/B Testing
The following sections provide step-by-step instructions for implementing Redpanda with Apache Druid for real-time A/B testing. The use case discussed in the previous section will be used for illustrative purposes.
The source code for this project is available in this GitHub repository. The goal of this sample project is to set up dependent software and ingest events using Redpanda's producer CLI utility; these events simulate the customers' interaction with your site when clicking on discount ads to unveil offers while ordering a product. You'll then stream the event information into Redpanda's designated topic and ingest the event into the Druid database named druid by defining a data-ingestion pipeline using the Druid UI. Following this, you'll run SQL queries on Druid to analyze the results of A/B testing.
Prerequisites
To follow this tutorial, you will need the following prerequisites:
- Docker or Podman installed on your machine. In this tutorial, Docker Desktop 4.13.0 is used.
- Python 3.10 or higher.
Setup Instructions for Dependent Software
As part of this project, you will set up dependent software that includes Redpanda, Druid, and PostgreSQL. Here is a brief overview of the significant files in the project:
- The docker-compose file, docker-compose.yml, has the instructions related to the list of images to be pulled for each container service and other settings that need to be configured for the container environment.
- The environment file contains the environment variables and corresponding values for Druid-related container services. Please refer to the following documentation links to learn more about these environment variables:
- The scripts/db/create-db.sh file contains the commands to connect to the PostgreSQL database and create the database and the required database users. The PostgreSQL database is used to store the metadata information of Druid that is essential for the working of a Druid cluster.
- The apps directory contains the application and its configuration file for simulating the real-time A/B testing.
Start by cloning the sample project repository in a machine using the following command:
git clone https://github.com/redpanda-data-blog/2022-apache-druid-a-b-testing
Grant the execute privilege to the script and create-db.sh by executing the following command:
cd 2022-apache-druid-a-b-testing && \
chmod +x scripts/db/create-db.sh
Now start the containers with the following command:
docker-compose -f docker-compose.yml up -dOpen the Docker dashboard, and you should see the following containers in running mode:

Execute Steps for Real-time A/B Testing
Now that you have set up the dependent software, the following steps explain how you can implement real-time A/B testing with Redpanda and Apache Druid.
Generate Events Using the Event Generator Application
To simulate an A/B testing scenario, you will use a Python application that generates events that correspond to the customer's interaction with an imaginary website (e.g., clicking discount ads to avail offers while ordering a product).
The application generates events for discount-at-home-page (A) and discount-at-category-page (B). The application weights A and B 50% by default, so when you run the application, it will use this default. You can change the A/B testing weight by changing the value in a configuration file called ab_config in the apps directory, which you’ll also do later on in this tutorial.
The application sends the messages to a topic called sales-by-discount. Run the following command to create the Redpanda topic.
docker exec -it redpanda \
rpk topic create sales-by-discount
If the topic is created successfully, the output should be as follows:
TOPIC              STATUS
sales-by-discount  OK
Generate the events by running the discount_event_generator.py Python application, which is in the apps directory. The application needs the kafka-python library, so before running the generator application, you should create a virtual environment under the 2022-apache-druid-a-b-testing directory and activate it:
python3 -m venv venv && source venv/bin/activateThen you can install the kafka-python dependency:
pip install kafka-pythonRun the discount_event_generator.py application to generate and send messages to your Redpanda topic sales-by-discount:
python apps/discount_event_generator.py
You should see the application leaving output for each event sent to Redpanda:
Data is sent: {"event-time": "2022-11-26 22:25:50.179", "goal-id": "sales-by-discount", "id": ["discount-at-category-page", "discount-at-home-page", "discount-at-home-page", "discount-at-home-page", "discount-at-category-page"], "event-trigger-location": "home", "user-id": "user38", "miscellaneous-details": {"place": "San Francisco", "region": {"id": "us-west", "description": "US West"}}}
discount-at-home-page (A): 50
discount-at-category-page (B): 50
Data is sent: {"event-time": "2022-11-26 22:25:55.186", "goal-id": "sales-by-discount", "id": ["discount-at-category-page", "discount-at-category-page", "discount-at-category-page", "discount-at-category-page", "discount-at-home-page"], "event-trigger-location": "home", "user-id": "user72", "miscellaneous-details": {"place": "Boston", "region": {"id": "us-east", "description": "US East"}}}
discount-at-home-page (A): 50
discount-at-category-page (B): 50
...output omitted...
Leave the terminal window open as the application keeps generating and sending messages in five second intervals.
To verify the events generated from the topic, execute the following command:
docker exec -it redpanda \
rpk topic consume sales-by-discount
The output should be as follows:
{
  "topic": "sales-by-discount",
  "value": "{\"event-time\": \"2022-11-26 15:04:24.251\", \"goal-id\": \"sales-by-discount\", \"id\": \"discount-at-home-page\", \"event-trigger-location\": \"home\", \"user-id\": \"user13\", \"miscellaneous-details\": {\"place\": \"Boston\", \"region\": {\"id\": \"us-east\", \"description\": \"US East\"}}}",
  "timestamp": 1669464264251,
  "partition": 0,
  "offset": 0
}
{
  "topic": "sales-by-discount",
  "value": "{\"event-time\": \"2022-11-26 15:04:29.252\", \"goal-id\": \"sales-by-discount\", \"id\": \"discount-at-category-page\", \"event-trigger-location\": \"fashion\", \"user-id\": \"user76\", \"miscellaneous-details\": {\"place\": \"Boston\", \"region\": {\"id\": \"us-east\", \"description\": \"US East\"}}}",
  "timestamp": 1669464269253,
  "partition": 0,
  "offset": 1
}
...output omitted...
Loading Events from Redpanda to the Druid Database
Open a web browser and access the URL http://localhost:8888/.
This URL will open Druid's user interface. To load the generated events from the Redpanda topic to the Druid database, click on the Load data option available in the top navigation bar.

Select Apache Kafka from the list of options shown in the Load data screen and then click the Connect data button.

In the next screen, input the value of Bootstrap servers as host.docker.internal:29092 (the address of the Redpanda broker running on your docker container) and Topic as sales-by-discount. Then click the Apply button to read events from the designated topic. Within a few seconds, you will see an output as shown below:
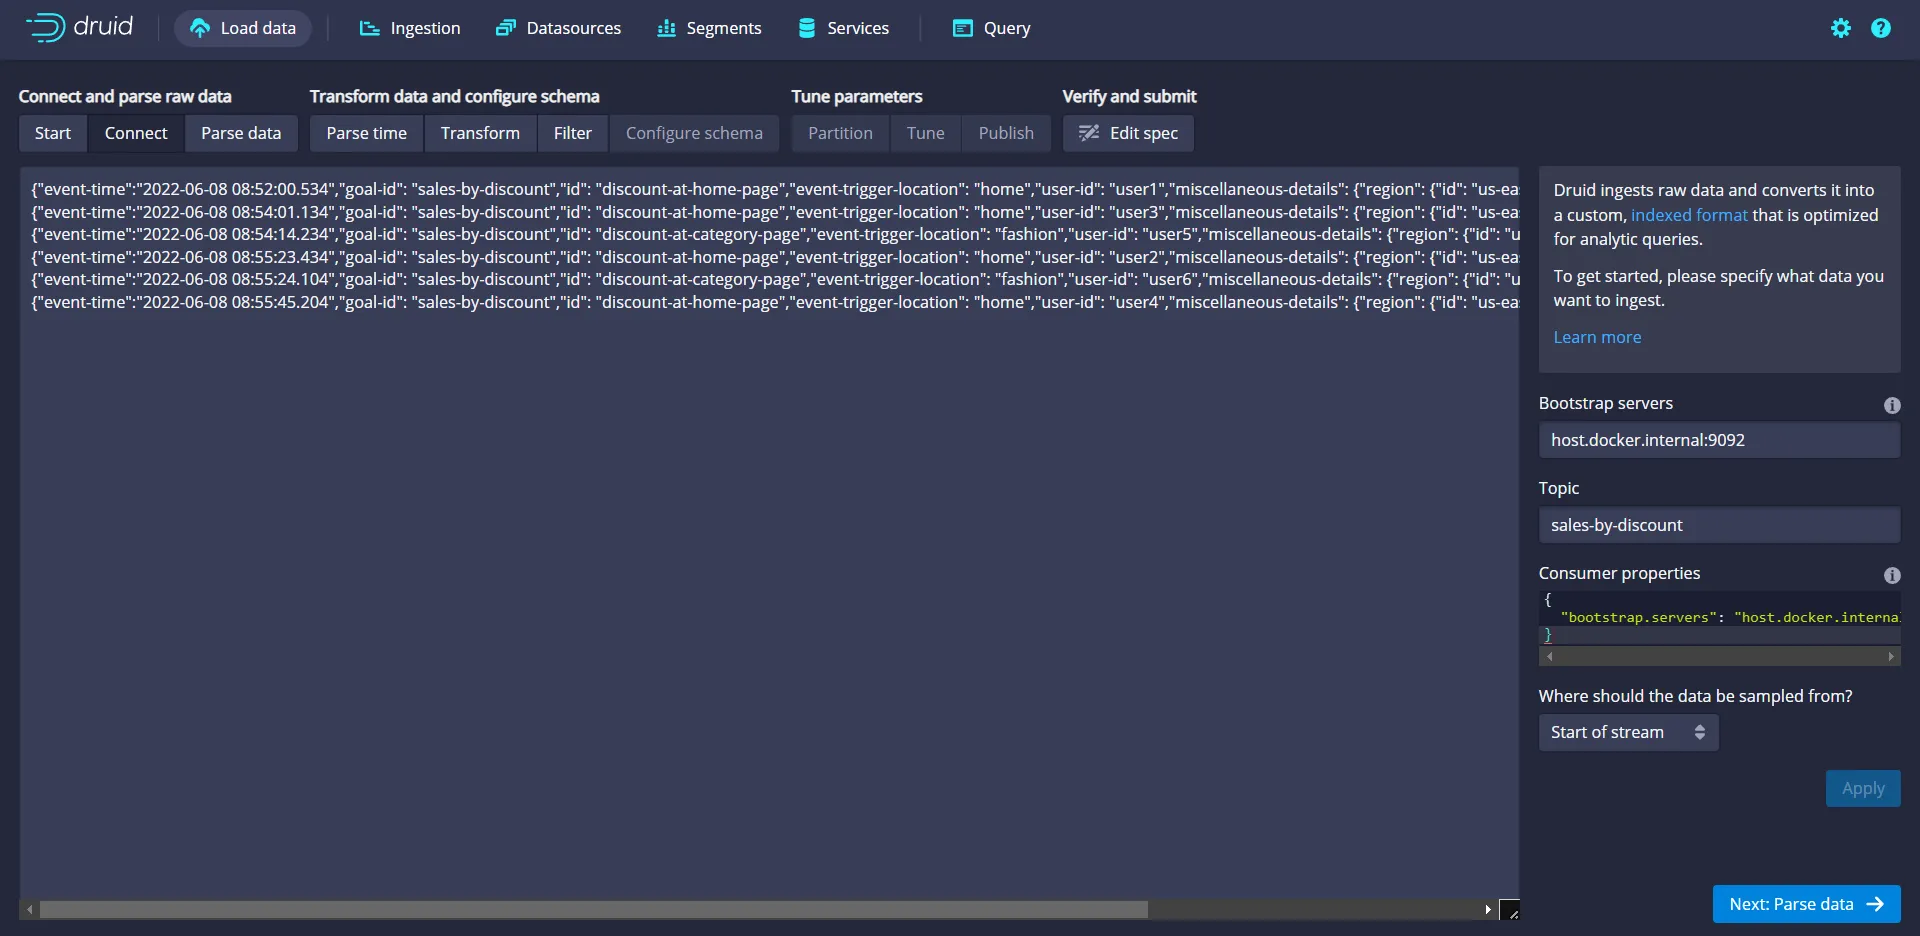
Events pushed to the topic are now visible in the Druid UI. These events are in JSON string format, so you should click the Parse data button to convert these into the tabular format as records in the database table.
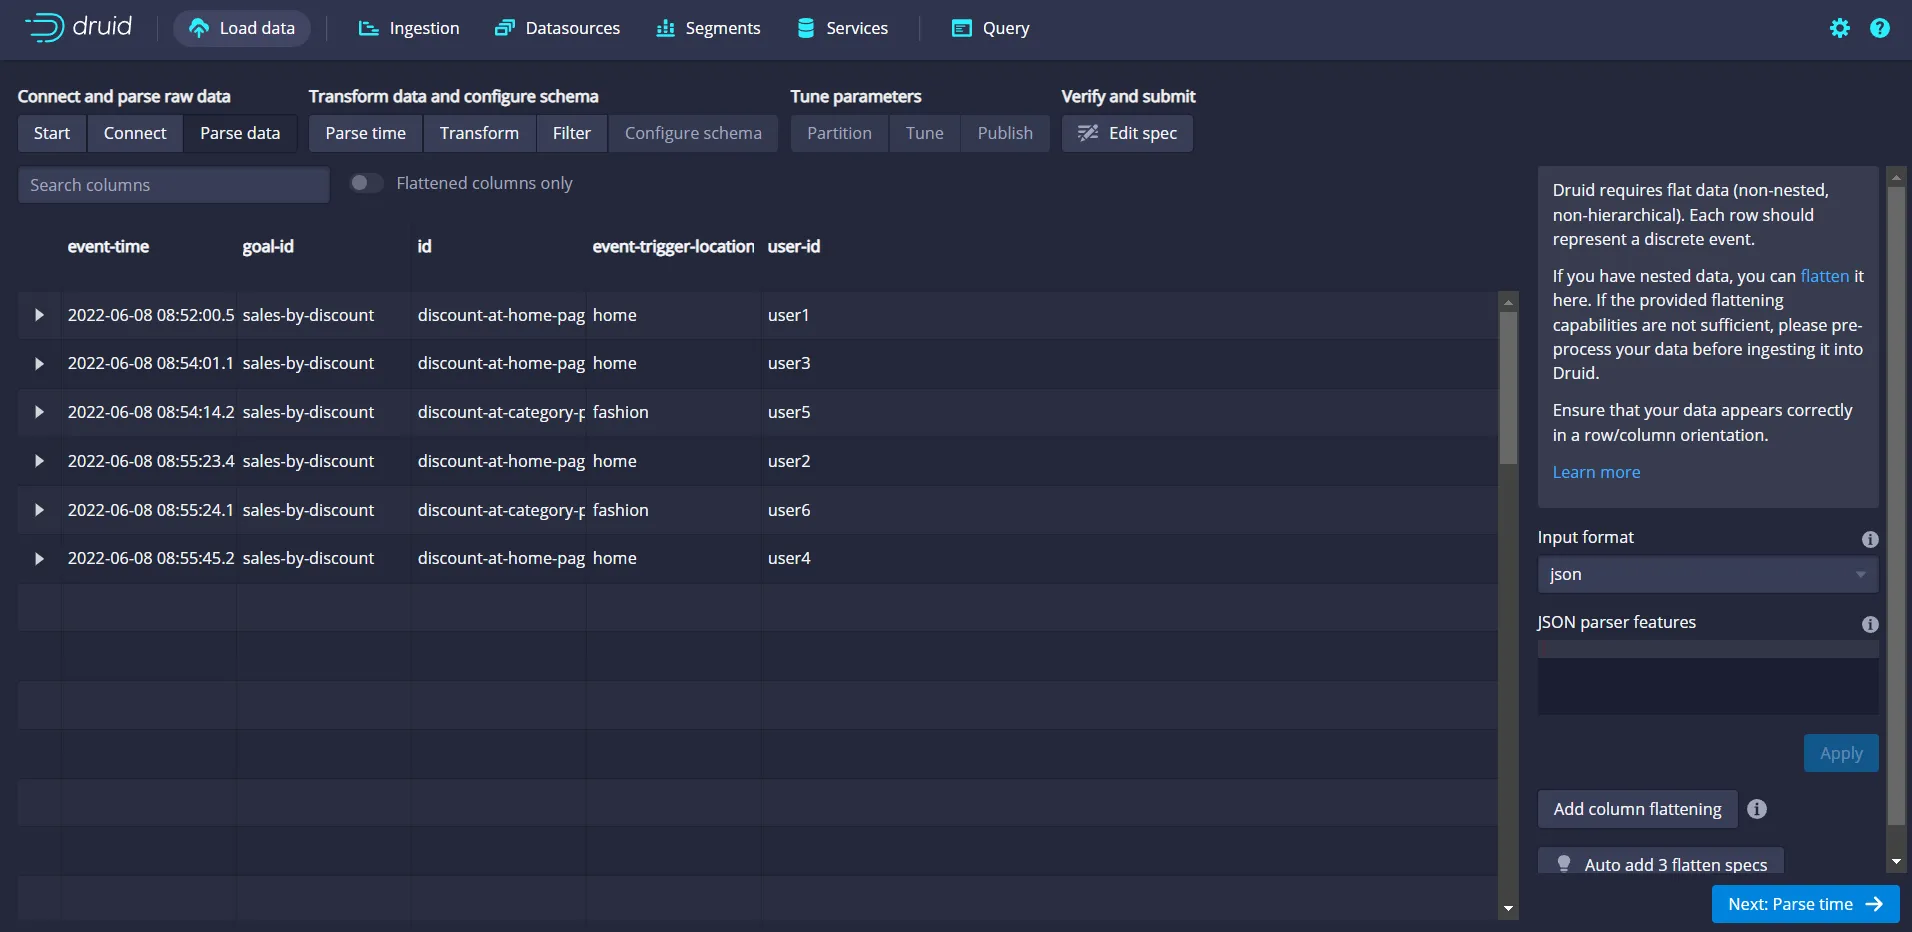
In the next screen you’ll see that, by default, Druid has automatically parsed some JSON fields (except the information available in the nested JSON field, miscellaneous-details) by identifying row labels and corresponding values. In reality, you might need to parse such nested JSON fields too. Druid offers a way to achieve this using a feature called column flattening. To parse the nested JSON fields manually, click the Add column flattening button available in the bottom right corner:
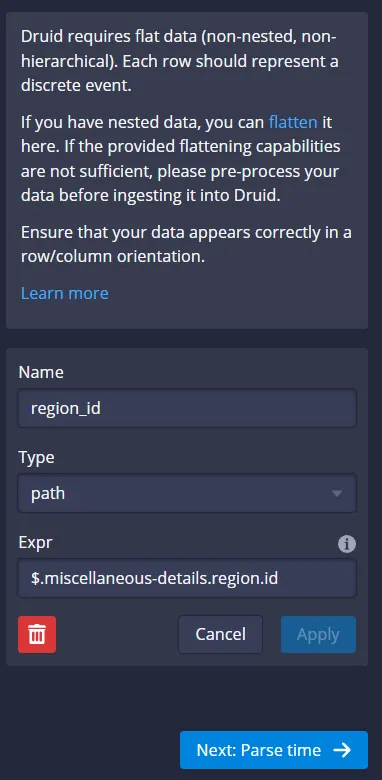
Fill in the values in the new set of fields (Name, Type, and Expr) as shown below:
Click Apply. In a few seconds, you'll see a new field, region_id, generated as output:
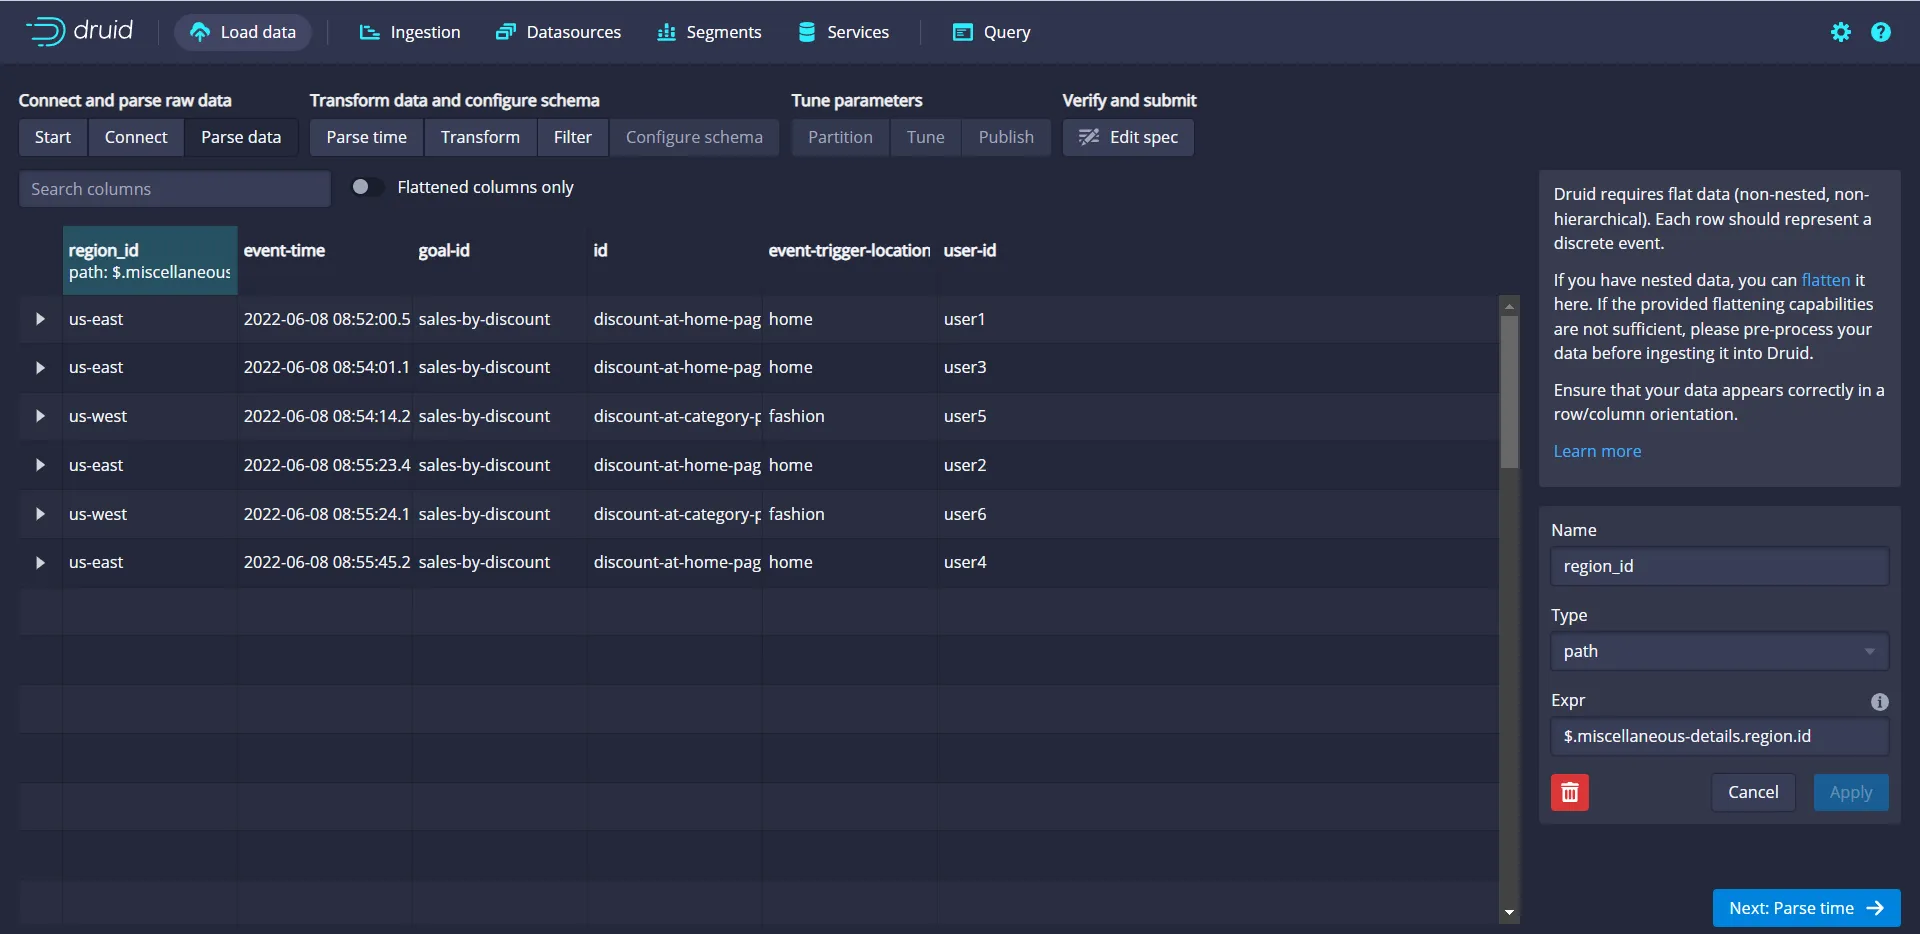
Move on to the next screen by clicking the Parse time button pictured in the bottom right corner of the screenshot above.
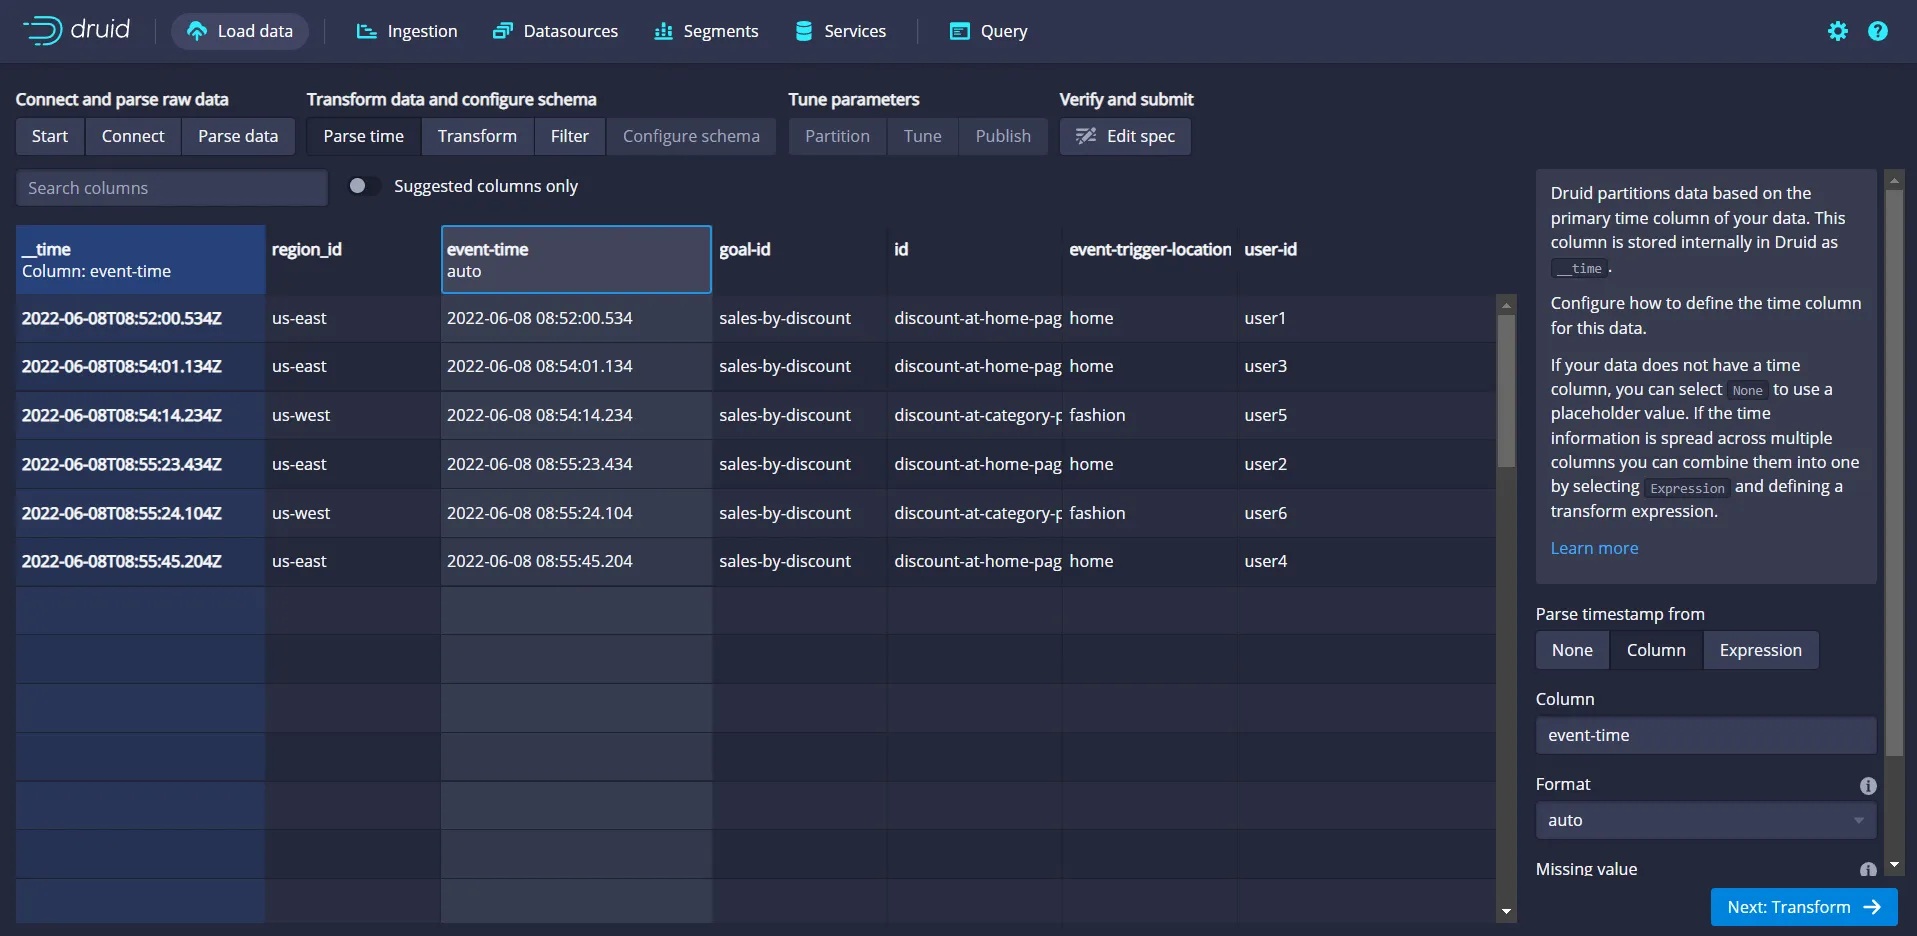
Accept the default autosuggestion by Druid in the Parse time screen interface. Druid automatically detects the time field in the data, which in this case is event-time, as shown below:
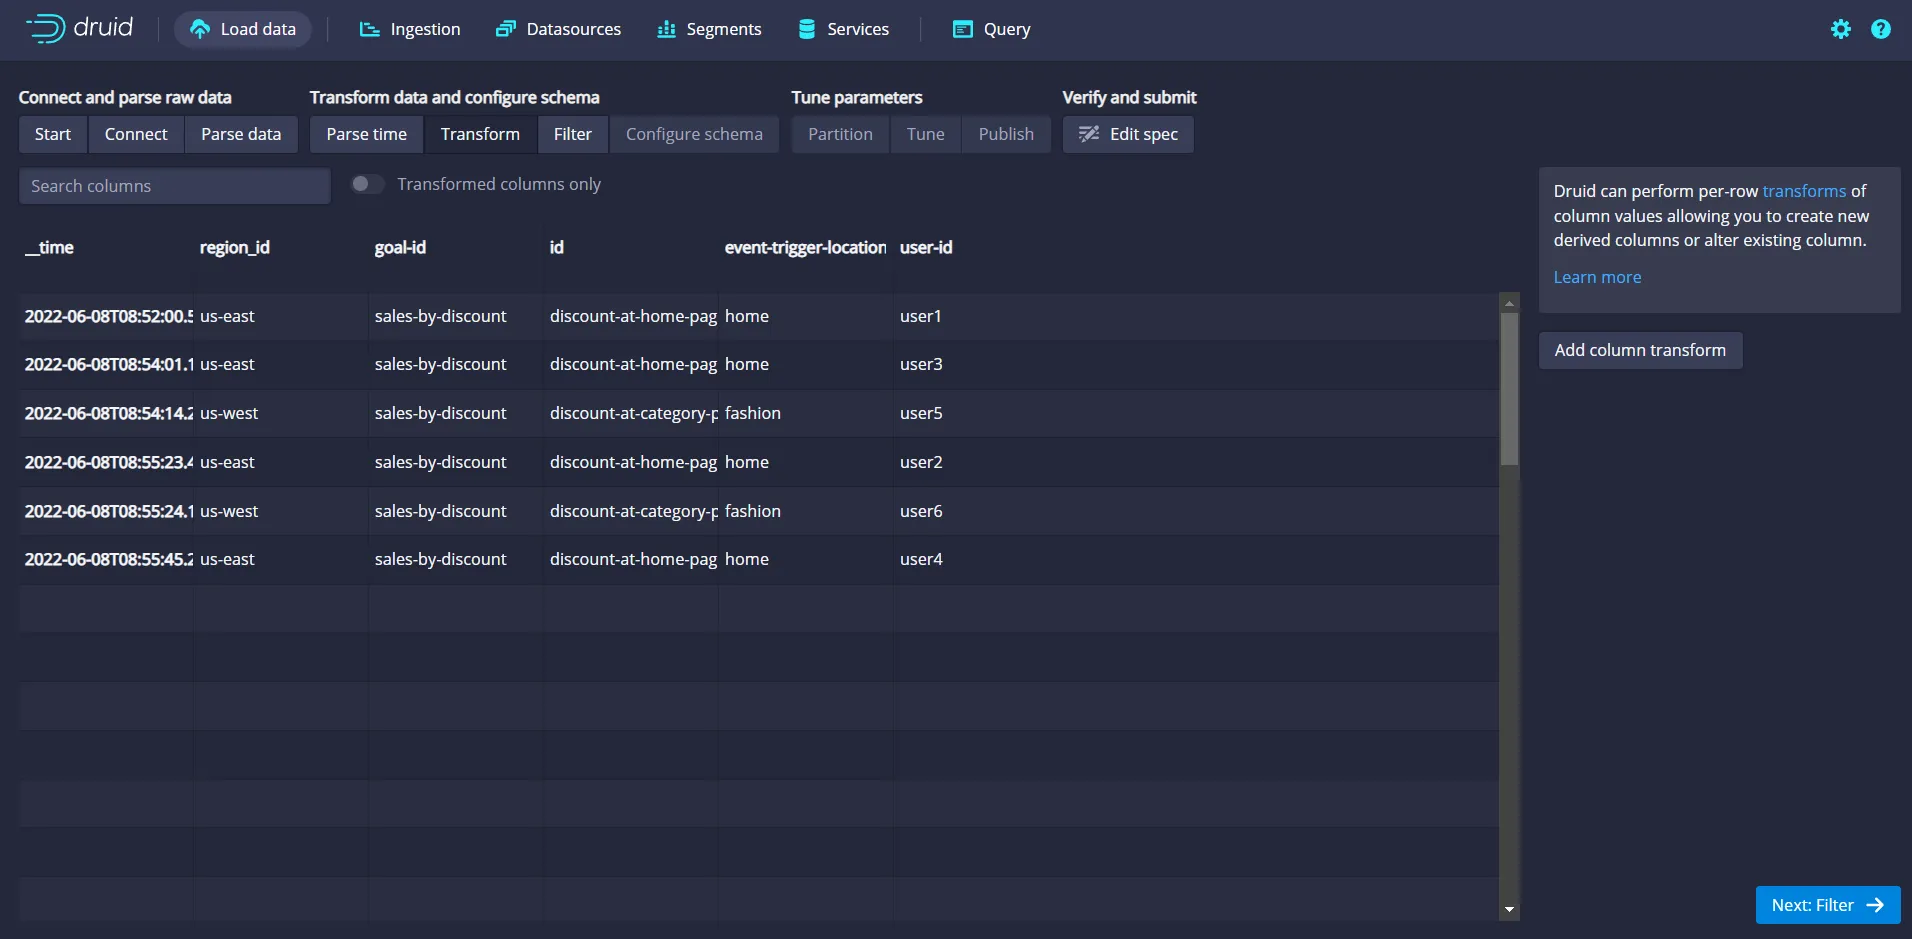
Click the Transform button to move on to the next page. You can use the Transform screen to perform the transformation of field values on a per-row basis, thereby facilitating a way to create additional derived columns or modify existing columns. In this case, there are no such needs, so move to the next screen by clicking the Filter button available at the bottom right corner of the screen, as shown below:
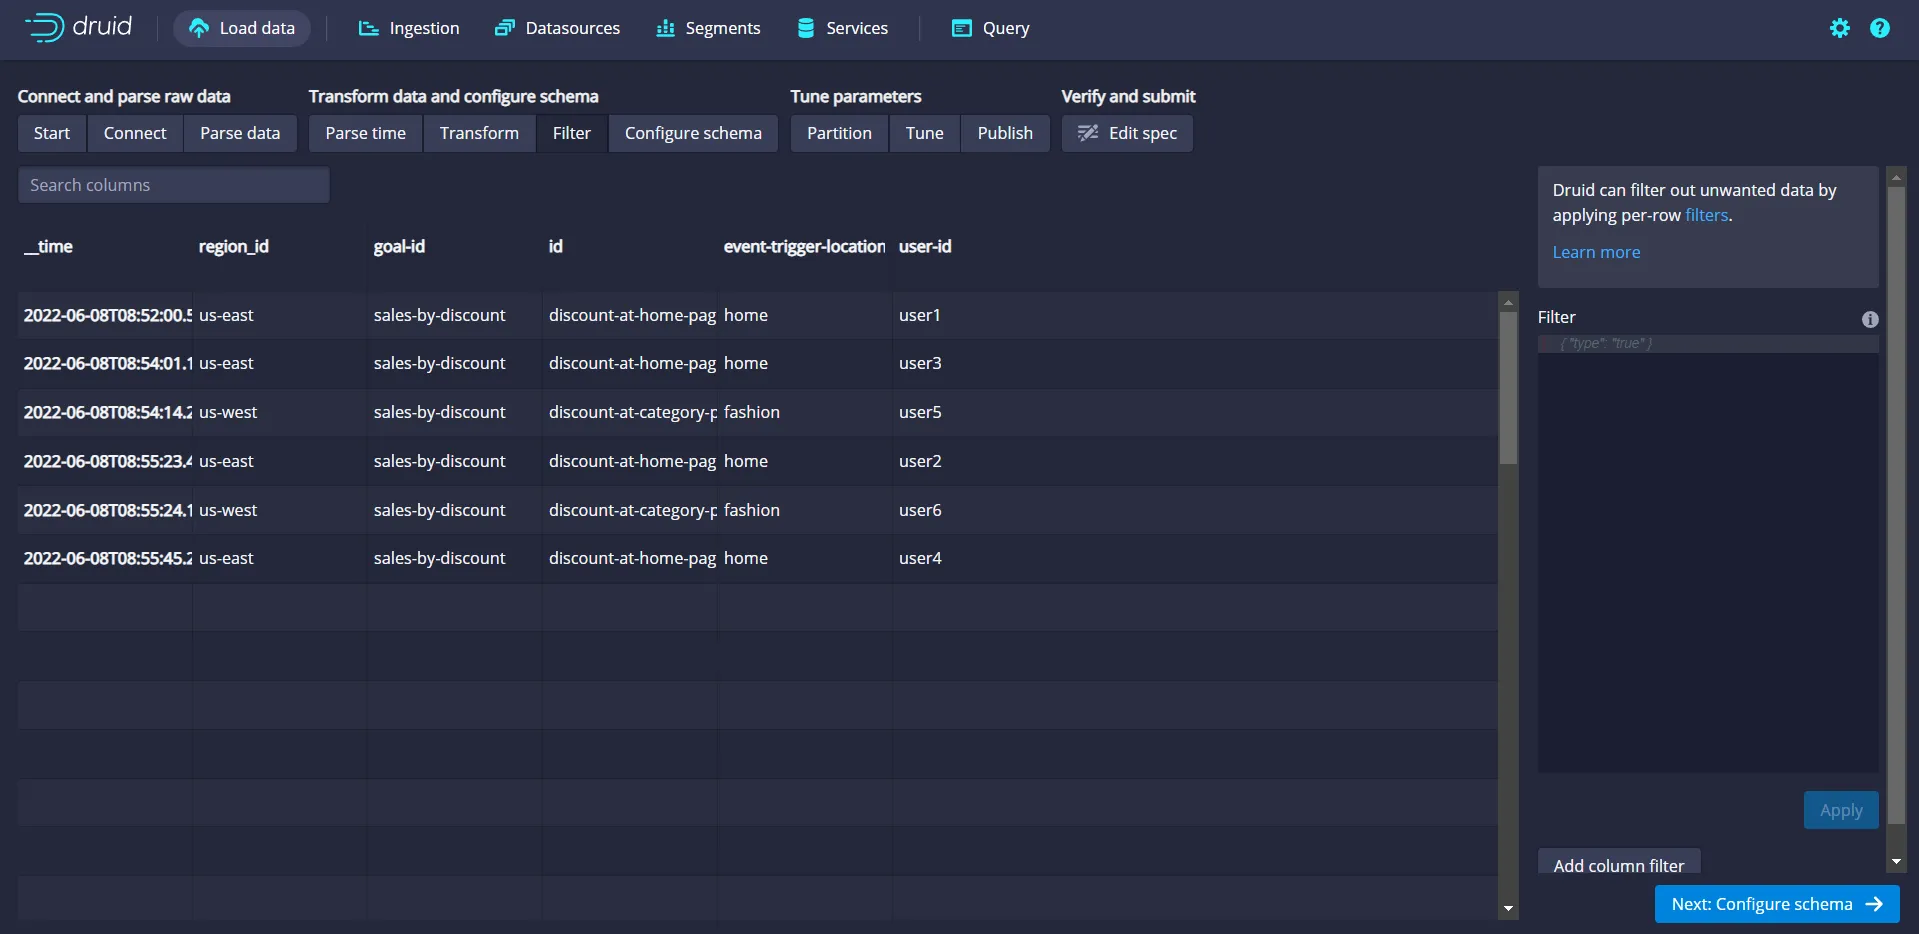
You can also use the Filter screen to filter the unwanted data by specifying conditions to act on a per-row basis. In this case, there are no such needs, so move to the next screen by clicking the Configure schema button available at the bottom right corner of the screen:.
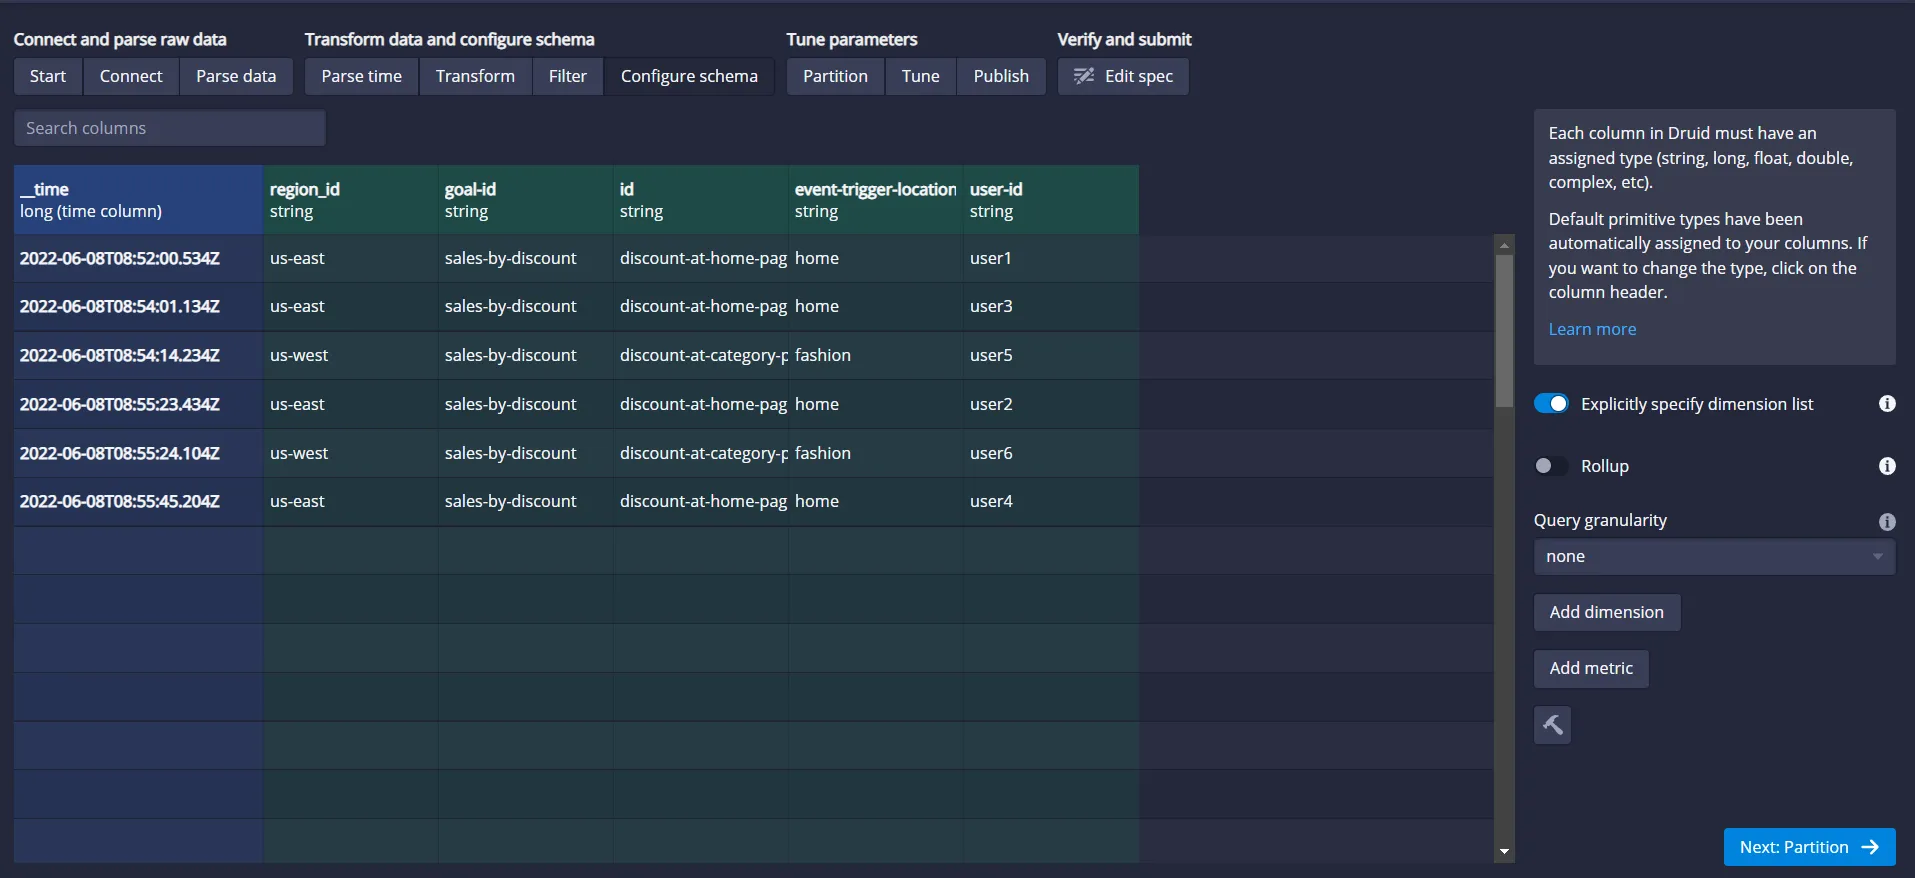
Use this Configure Schema screen to define the data type of each column in Druid. In this case, the default type's automatically assigned Druid should be enough. So, move on to the next screen by clicking on the Partition button, as shown below:
You can use partitioning screen options to segregate the data stored based on the segment granularity being chosen. In this case, choose the segment granularity option as an hour. So, every hour's data will be stored together, allowing you to improve query performance. In reality, you can choose the granularity based on the site business and query needs. Leave the default values as suggested by Druid for other fields and proceed by clicking on the Tune button:

Use the Tune screen to fine-tune the settings based on your project needs:
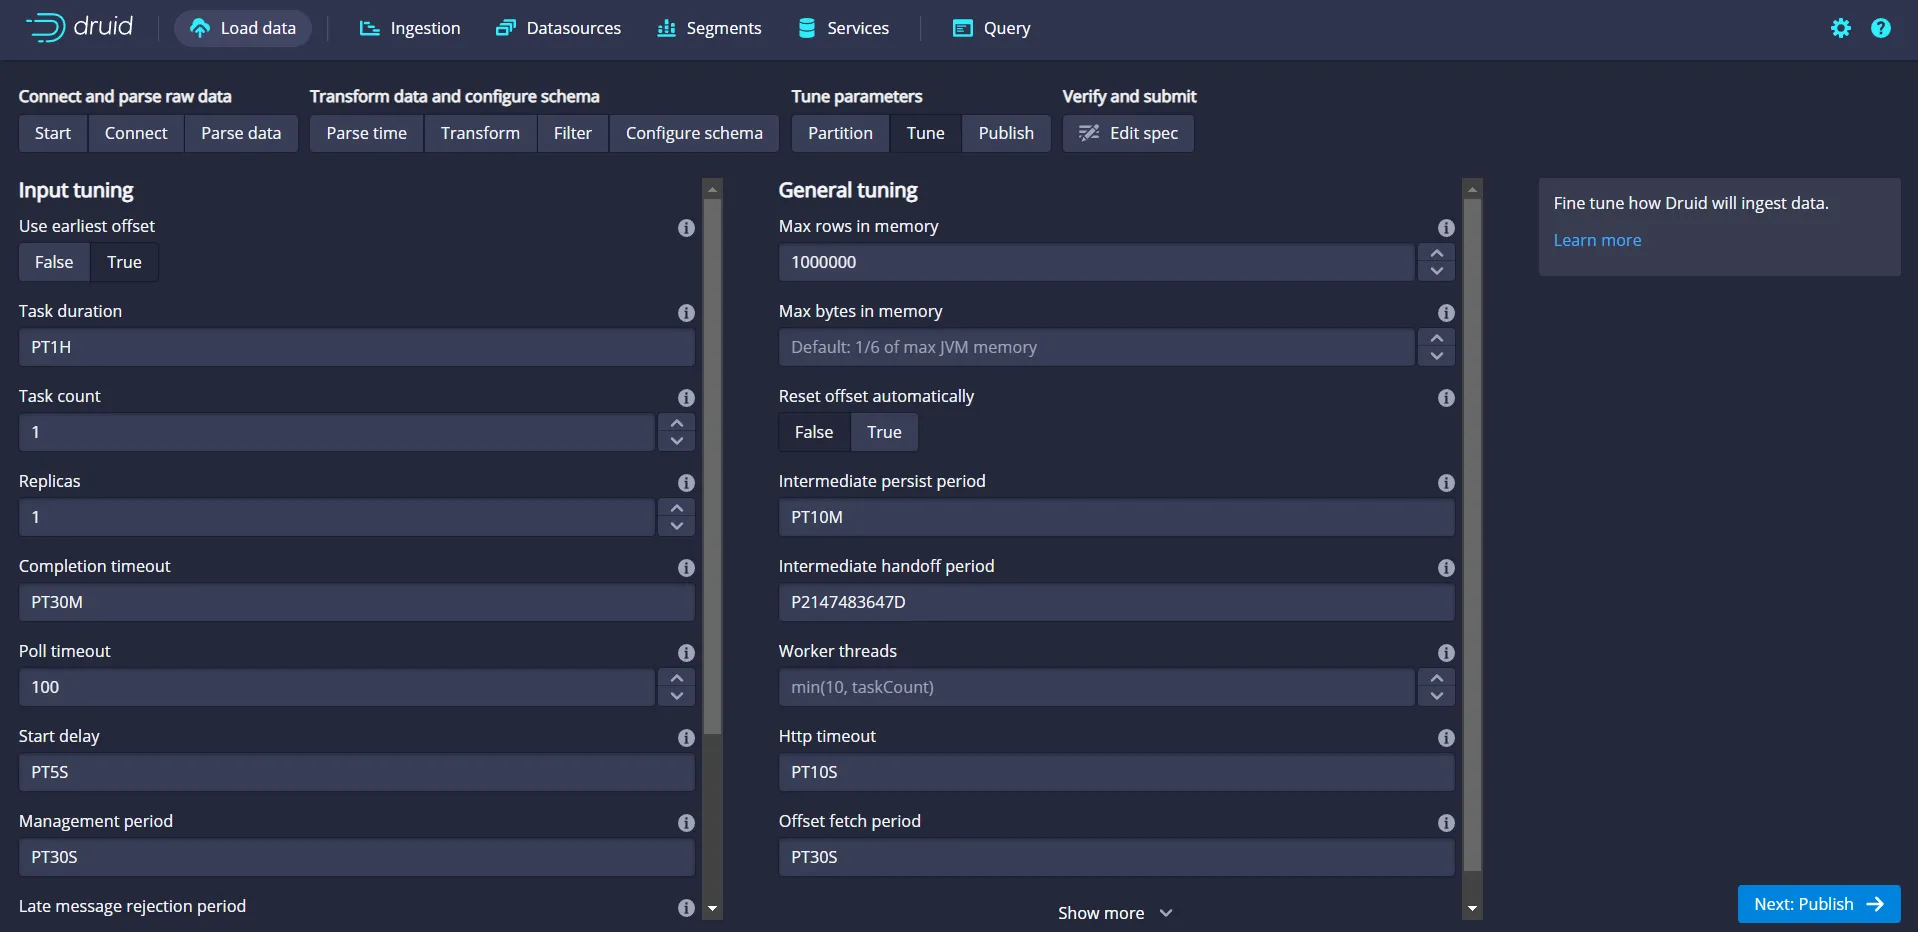
For this example project, click the True option beneath the first field at the top, Use earliest offset. This is to read/process the events from the first offset in the Kafka topic. Then click the Publish button to proceed.
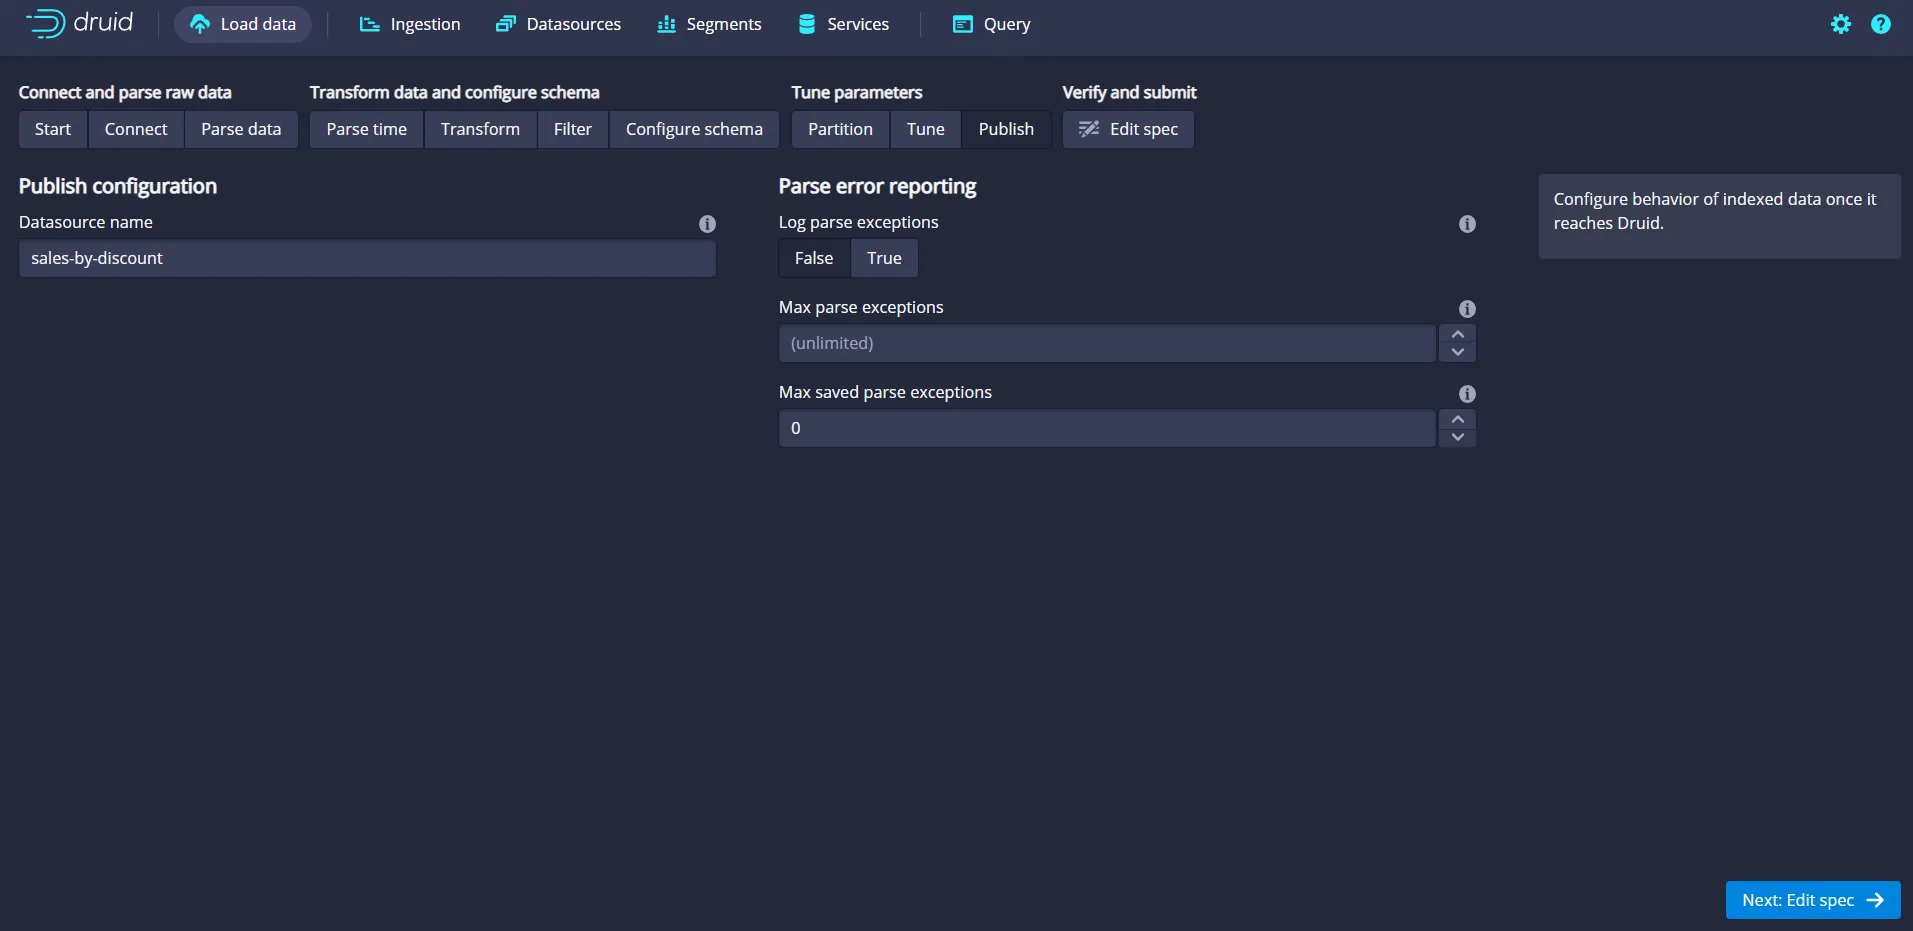
Druid chooses a default data source name based on the topic name. In this case, it is sales-by-discount, which would be the name of the data source table that you will be interacting with through the query window. Choose the defaults shown by Druid in the Publish screen and proceed next by clicking on the Edit spec button:
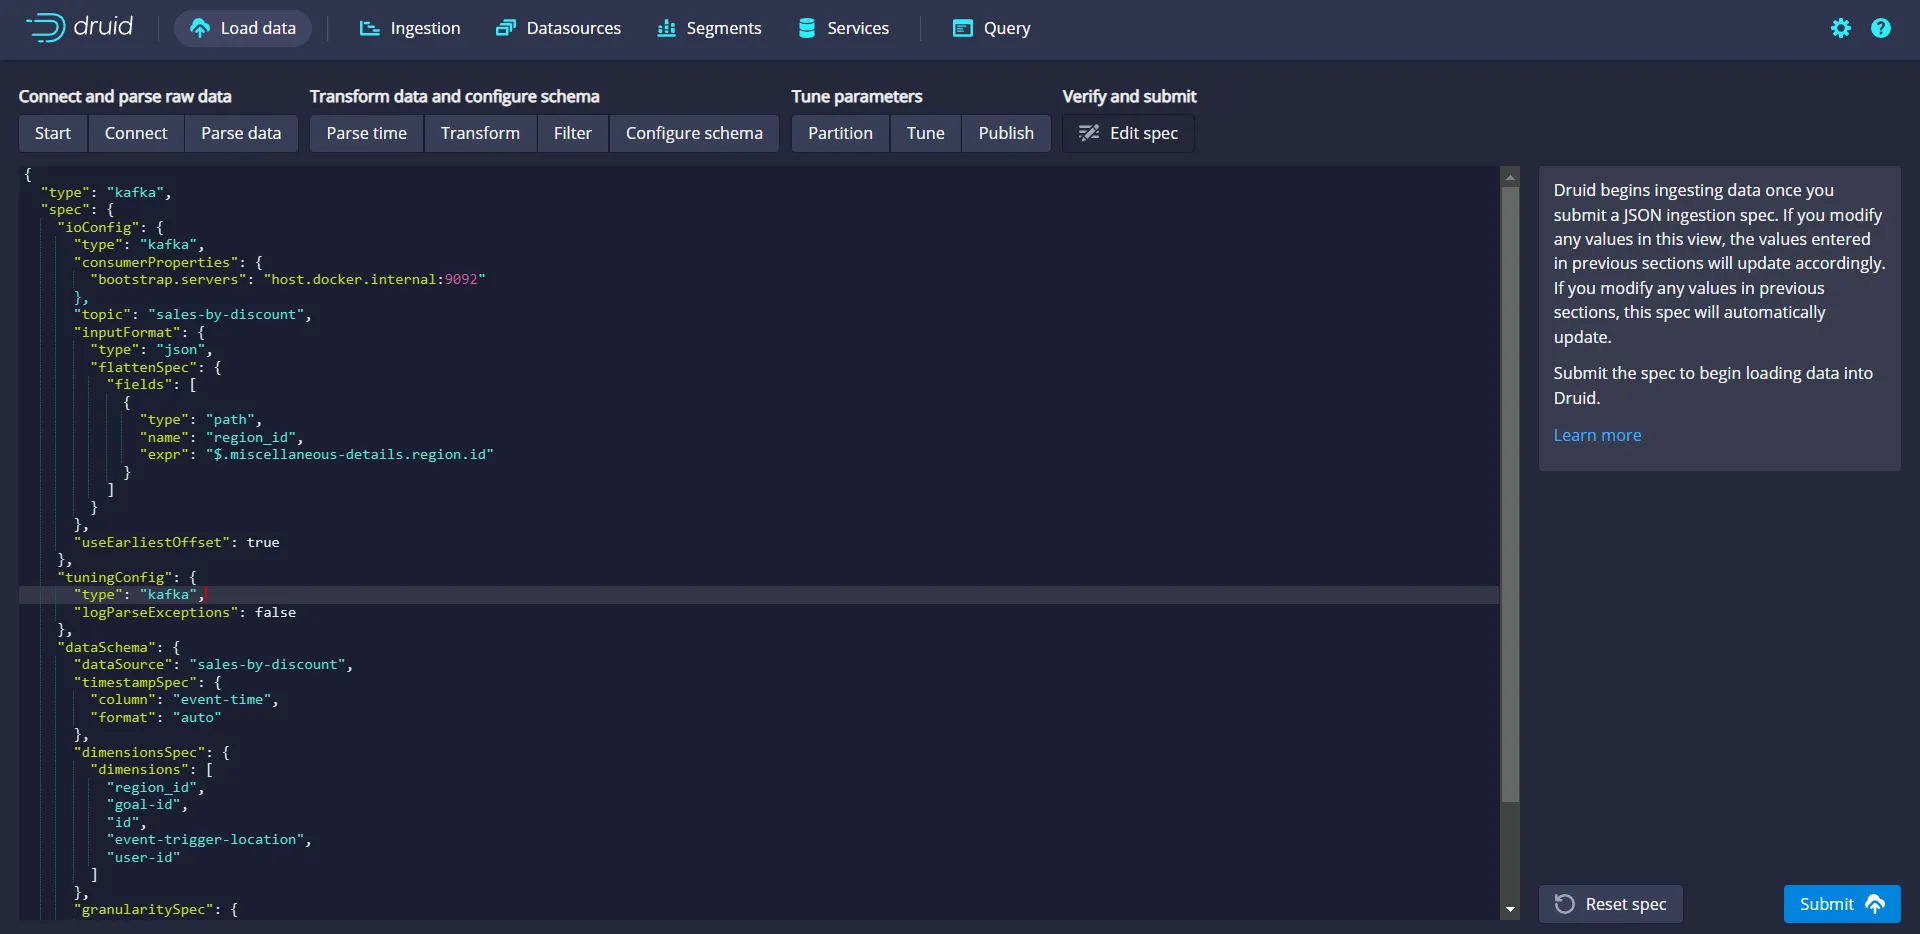
The Edit spec screen is used to review and edit the chosen settings from the previous screens. Review your configuration and click the Submit button:
Druid will take you to the ingesting screen, where you can see the status of the data source defined. Click the Refresh button on the screen to view the updated status and confirm that the status has changed to RUNNING:

Once the status has changed to RUNNING, navigate to the Query screen by clicking the Query option from the top navigation bar.
Examine the Real-time A/B Testing Results
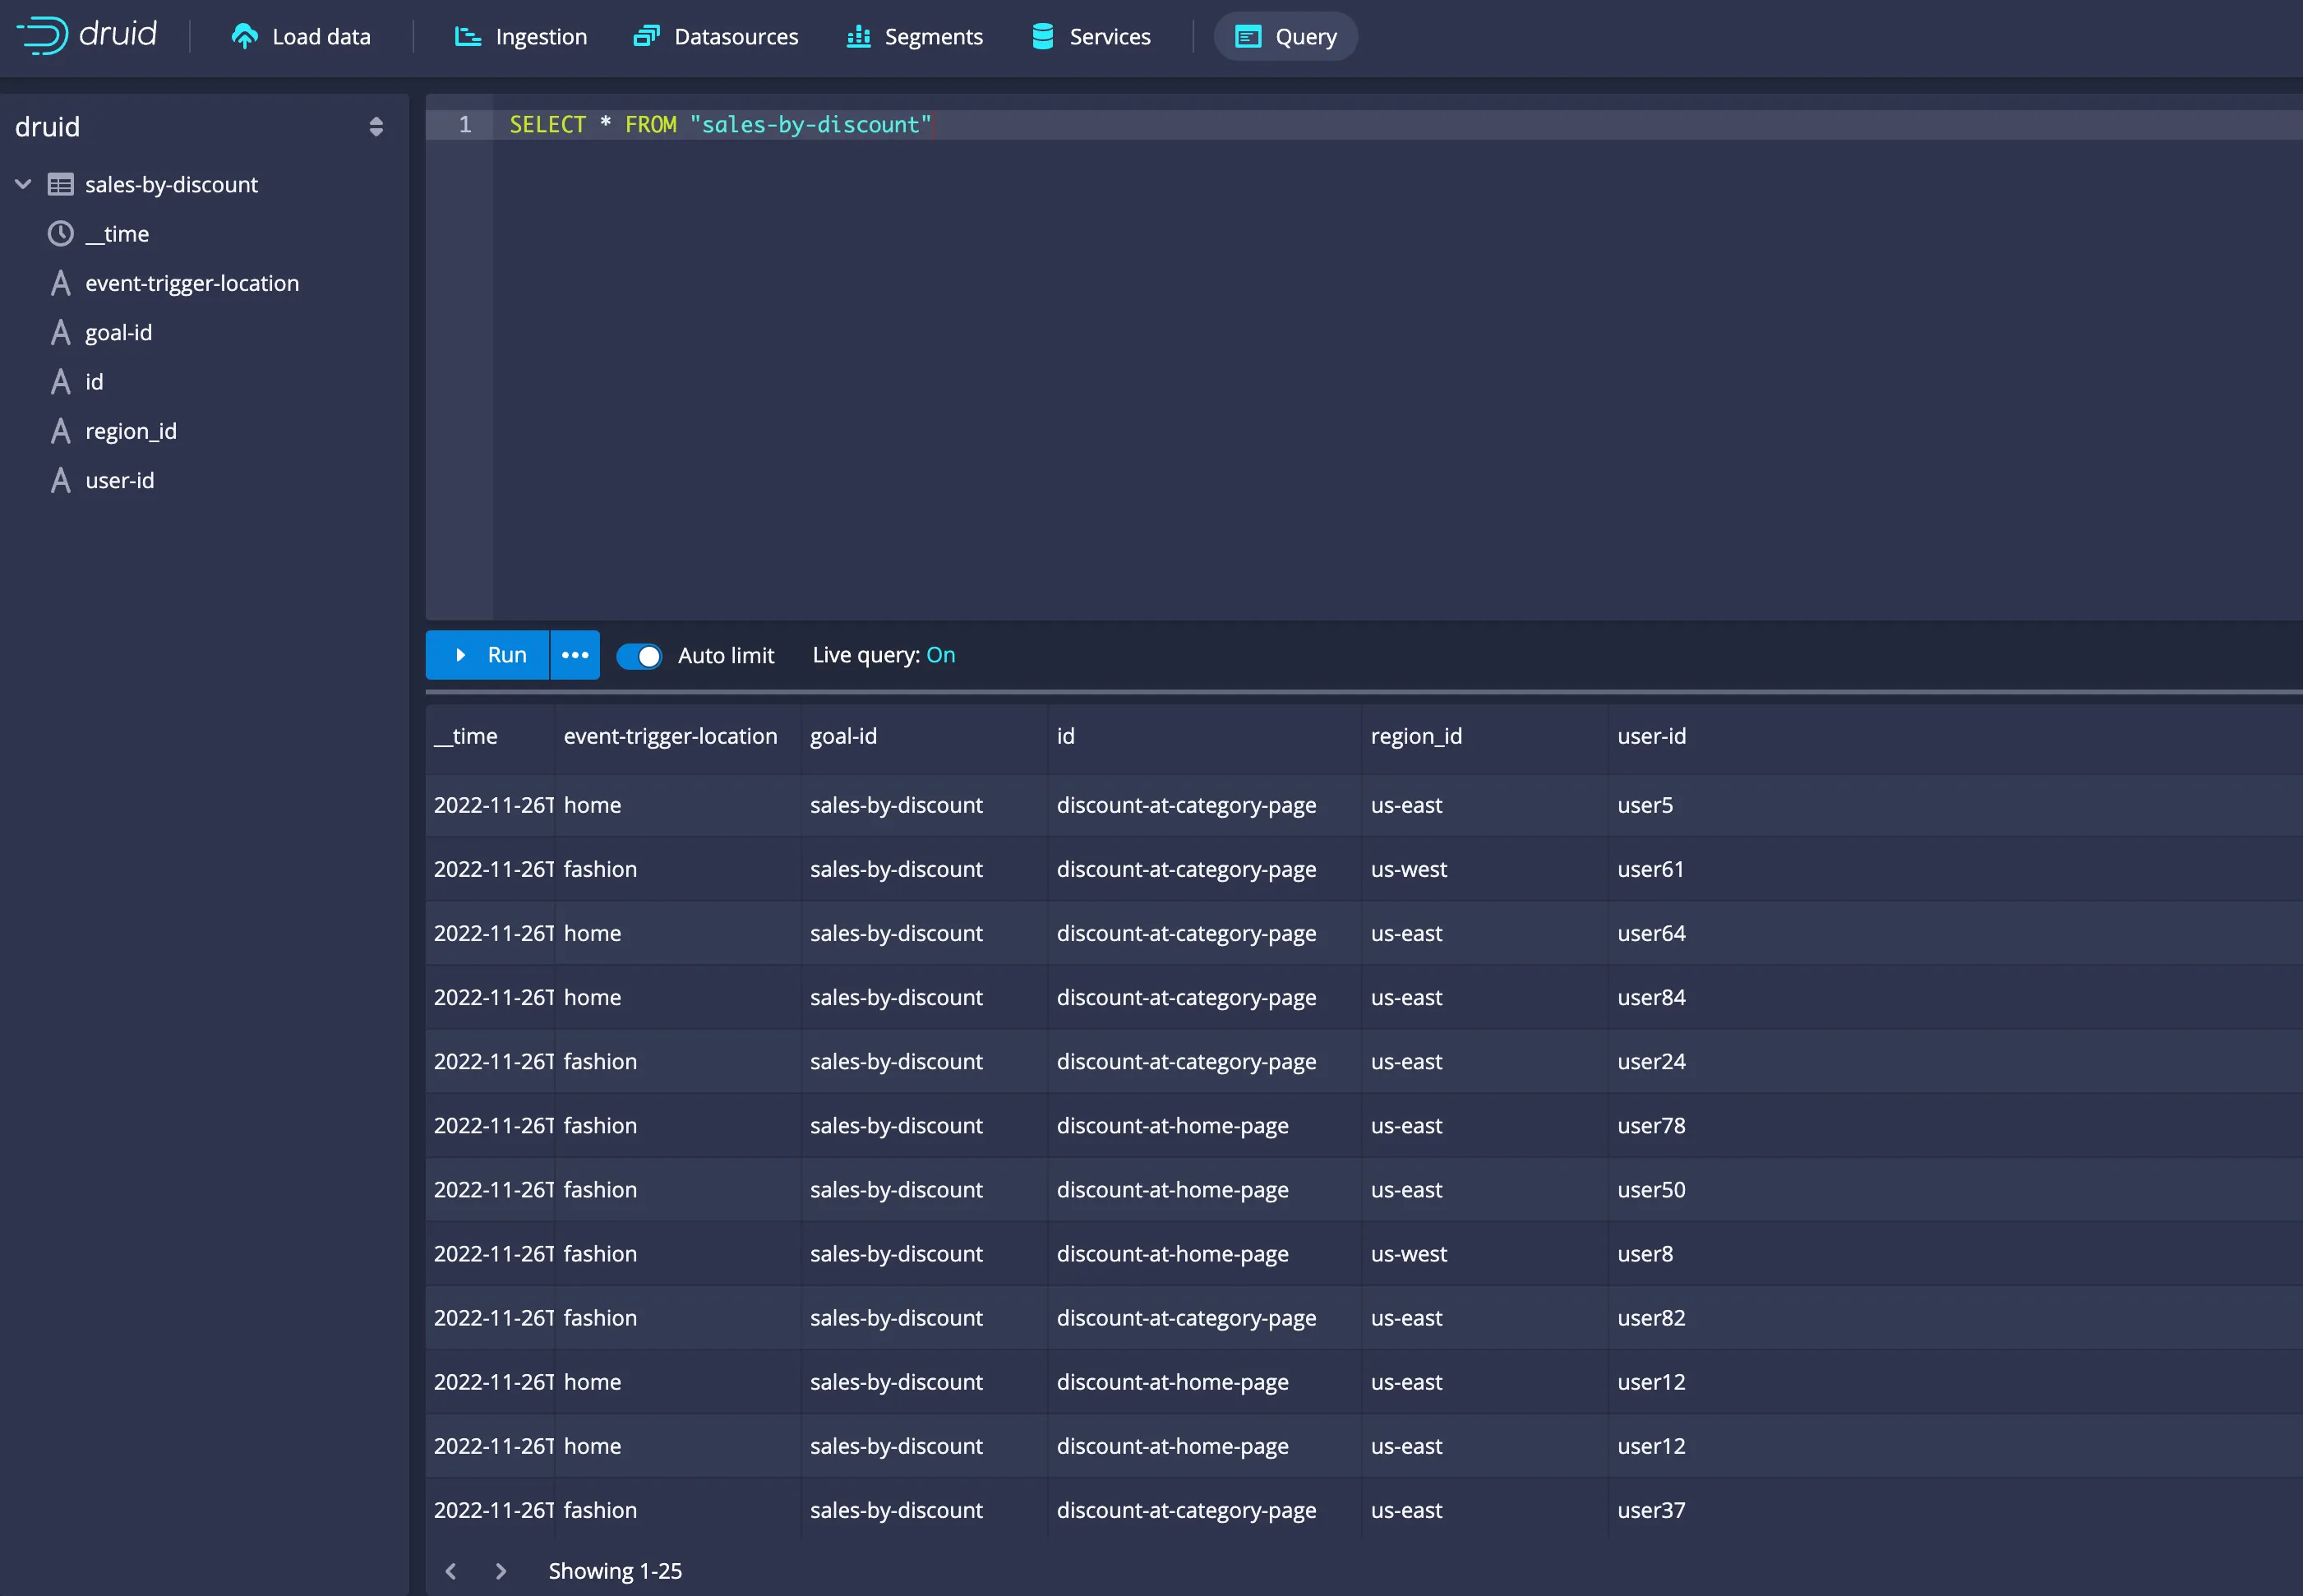
On the Query window, you can execute the following command in the SQL code editing panel to view the rows ingested into the Druid database from a data source named sales-by-discount:
SELECT * FROM "sales-by-discount"
The query window with the above SQL command and the results fetched are pictured below:
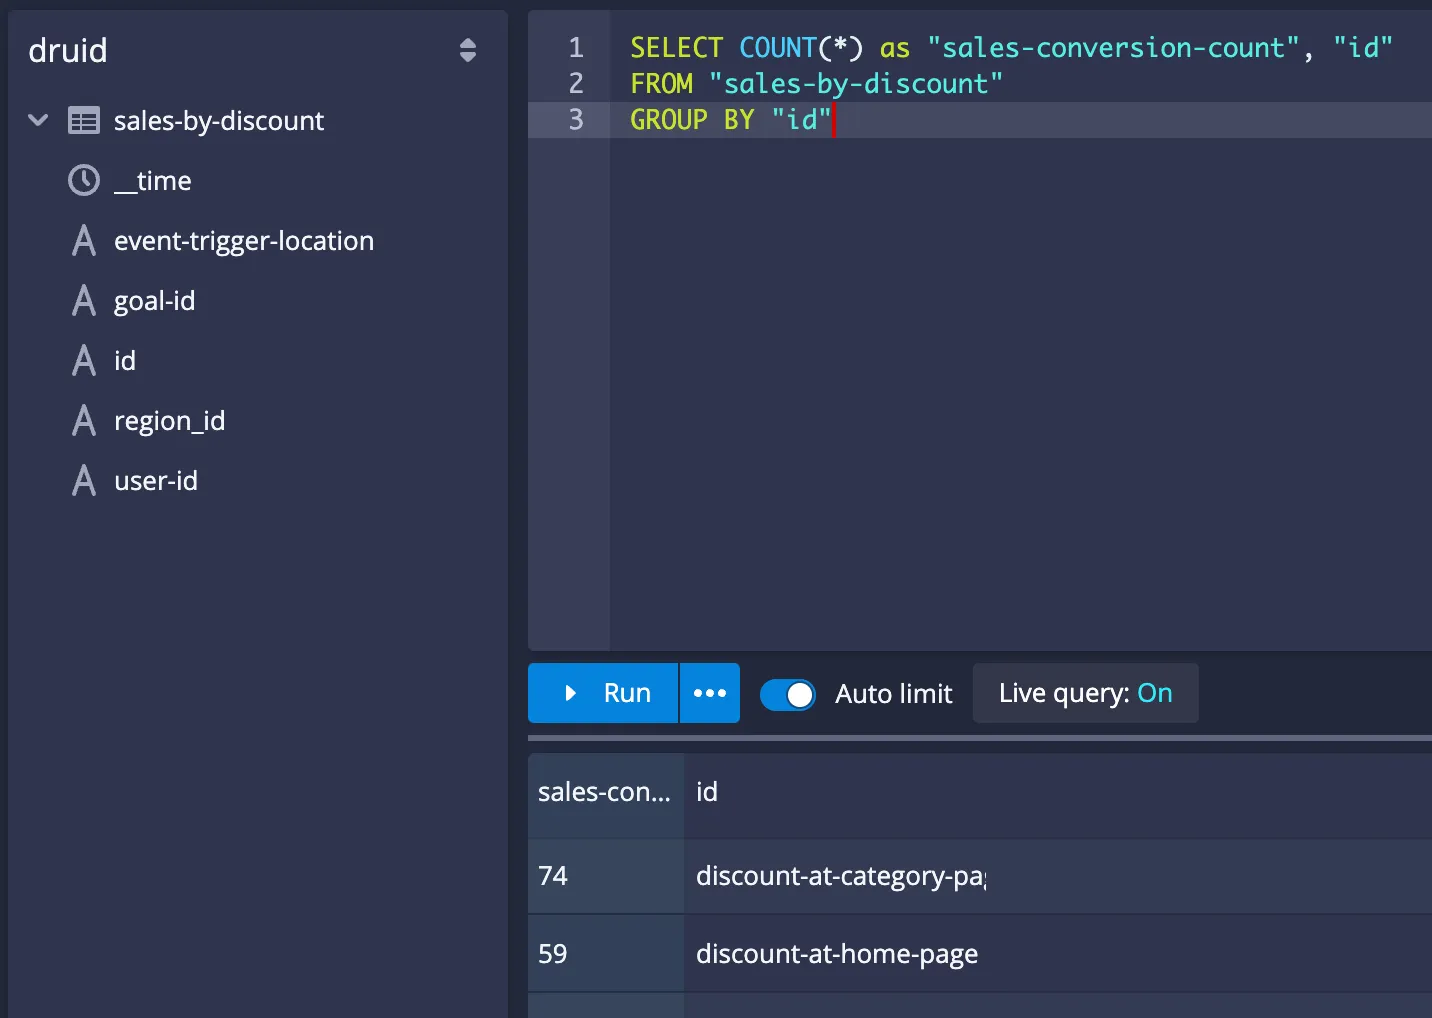
Replace the above SQL command with the following command to get the aggregated results of A/B testing:
SELECT COUNT(*) as "sales-conversion-count", "id"
FROM "sales-by-discount"
GROUP BY "id"
The output should be as follows:
So far, you've implemented the A/B testing with Apache Druid and Redpanda. Druid ingests the data from Redpanda in real-time, but you haven't used it yet to create any real-time A/B testing action.
To implement the real-time mechanism for the A/B testing, create a Python file called ab_tester.py in the apps directory, and add the following content in it:
import time

from pydruid.db import connect

def read_ab_config():
    with open('./apps/ab_config', 'r') as f:
        lines = f.readlines()
        return int(lines[0])

def update_ab_config(n):
    with open('./apps/ab_config', 'w') as f:
        f.write(str(n))

def main():
    weights = {"discount-at-home-page": 0, "discount-at-category-page": 0}
    percentage_change_amount = 5

    while True:
        conn = connect(host='localhost', port=8082, path='/druid/v2/sql/', scheme='http')
        curs = conn.cursor()
        curs.execute("""
            SELECT COUNT(*) as "sales-conversion-count", "id"
            FROM "sales-by-discount"
            GROUP BY "id"
            ORDER BY "sales-conversion-count"
        """)

        discount_at_home_page_percentage= read_ab_config()

        if discount_at_home_page_percentage == 100:
            break

        for row in curs:
            weights[row[1]] = row[0]

        print(weights)

        if weights["discount-at-home-page"] > weights["discount-at-category-page"]:
            update_ab_config(discount_at_home_page_percentage + percentage_change_amount)
        else:
            update_ab_config(discount_at_home_page_percentage - percentage_change_amount)

        print(f"discount_at_home_page_percentage updated to {read_ab_config()}")

        time.sleep(60)

if __name__ == "__main__":
    main()
The code runs the same query you've run on the Druid web interface. It gets the values for discount-at-home-page and discount-at-category-page and checks which one has bigger conversion. Depending on the conversion weight, it changes the value in the ab_config file with a 1 minute interval, so that the A/B testing percentage will change for the data generator application, which simulates the user interaction.
Before running the application, you must install the pydruid and sqlalchemy library dependencies. Run the following command in a new terminal window, in which you should activate the Python virtual environment you've created before:
pip install pydruid sqlalchemy
Run the following command to run the ab_tester.py application:
python apps/ab_tester.py
You should see the first percentage change output similar to the following:
{'discount-at-home-page': 521, 'discount-at-category-page': 415}
discount_at_home_page_percentage updated to 55
After each minute, you should see that the application updates the A/B testing percentage dynamically using the value from Druid:\
discount_at_home_page_percentage updated to 55
{'discount-at-home-page': 546, 'discount-at-category-page': 450}
discount_at_home_page_percentage updated to 60
{'discount-at-home-page': 584, 'discount-at-category-page': 472}
discount_at_home_page_percentage updated to 65
{'discount-at-home-page': 623, 'discount-at-category-page': 493}
discount_at_home_page_percentage updated to 70
{'discount-at-home-page': 669, 'discount-at-category-page': 507}
discount_at_home_page_percentage updated to 75
Verify that discount_event_generator.py uses the changed percentage to simulate the right user conversion percentage. You should see something similar to the following:
...output omitted...
Data is sent: {"event-time": "2022-11-26 23:37:32.252", "goal-id": "sales-by-discount", "id": ["discount-at-category-page", "discount-at-home-page", "discount-at-category-page", "discount-at-category-page", "discount-at-home-page"], "event-trigger-location": "home", "user-id": "user57", "miscellaneous-details": {"place": "San Francisco", "region": {"id": "us-west", "description": "US West"}}}
discount-at-home-page (A): 55
discount-at-category-page (B): 45
Data is sent: {"event-time": "2022-11-26 23:37:37.258", "goal-id": "sales-by-discount", "id": ["discount-at-category-page", "discount-at-category-page", "discount-at-category-page", "discount-at-category-page", "discount-at-category-page"], "event-trigger-location": "fashion", "user-id": "user75", "miscellaneous-details": {"place": "New York", "region": {"id": "us-east", "description": "US East"}}}
discount-at-home-page (A): 60
discount-at-category-page (B): 40
...output omitted...
Data is sent: {"event-time": "2022-11-26 23:39:42.347", "goal-id": "sales-by-discount", "id": ["discount-at-home-page", "discount-at-category-page", "discount-at-home-page", "discount-at-home-page", "discount-at-category-page"], "event-trigger-location": "fashion", "user-id": "user60", "miscellaneous-details": {"place": "Boston", "region": {"id": "us-east", "description": "US East"}}}
discount-at-home-page (A): 65
discount-at-category-page (B): 35
Data is sent: {"event-time": "2022-11-26 23:39:47.350", "goal-id": "sales-by-discount", "id": ["discount-at-home-page", "discount-at-category-page", "discount-at-home-page", "discount-at-home-page", "discount-at-home-page"], "event-trigger-location": "fashion", "user-id": "user23", "miscellaneous-details": {"place": "New York", "region": {"id": "us-east", "description": "US East"}}}
discount-at-home-page (A): 70
discount-at-category-page (B): 30
...output omitted...
Congratulations! You've implemented a real-time A/B testing system using Redpanda and Apache Druid.
Conclusion
With the use case in this article, you've experienced the power of real-time A/B testing with Redpanda and Druid. Events from your sites/apps are streamed through the real-time data processing pipeline as they get generated and reach the desired topic on Redpanda. You’ve loaded the data from a Redpanda topic in real-time using Apache Druid and updated the A/B testing rates in real-time by programmatically querying Apache Druid. You can also use the results of the A/B tests to dynamically stop testing if you see an overwhelmingly positive result for one test. For instance, following along with the example from this article, if you see the majority of users not using the discount at the category page, you can build logic to stop testing and instead display the discount for all users on the home page. This way, you don't lose out on potential sales by continuing your A/B test.
To find out about the tech stack used here, refer to the documentation links of each software presented in this article. You can also check out the source available for Redpanda on GitHub and join the Redpanda community on Slack. It's also worth exploring how other technologies like Snowflake, S3, Azure Blob, and GCS storage can be integrated with Kafka Connect.
Related articles
VIEW ALL POSTSLet's keep in touch
Subscribe and never miss another blog post, announcement, or community event. We hate spam and will never sell your contact information.


