Full CDC semantics land in the Iceberg output for Redpanda Connect
Your lakehouse mirrors the database, instantly.


To integrate Redpanda's Iceberg topics with PuppyGraph for graph analysis, you need to follow several steps. First, prepare and deploy your data using Docker and Docker Compose, and the Redpanda command-line tool. Then, model your graph using the PuppyGraph Web UI. After that, import your incremental data. Finally, query your graph using PuppyGraph's support for Gremlin and Cypher queries. You can refer to the Redpanda - Iceberg Docker Compose example and the graph processing pipeline demo for more details.
Redpanda's Iceberg Topics is a feature introduced through Redpanda's integration with Apache Iceberg. It bridges the gap between real-time streaming data and offline analytics, simplifying how organizations harness their streaming data for analytics. The Iceberg integration uses Tiered Storage, so when a cluster or topic has Tiered Storage enabled, Redpanda stores the Iceberg files in the configured Tiered Storage bucket or container. The data lives in both a streaming log format and a table format without any extra copying or ETL.
Integrating Redpanda's Iceberg topics with PuppyGraph provides a streamlined approach for real-time graph analysis. This integration simplifies workflows and enables high-speed graph queries, removing the complexities often encountered with traditional graph technologies. It offers a true no-ETL solution for performing real-time graph analytics, ensuring that analytics and insights stay up to date with real-time events.
Apache Iceberg is an open-source table format that revolutionizes data management in data lakes. It was originally created by Netflix in 2017 and later donated to the Apache Software Foundation. Iceberg addresses the limitations of traditional data lake formats and brings warehouse-like capabilities to data lake storage. It offers user-friendly features like hidden partitioning and partition evolution, and supports both copy-on-write and merge-on-read strategies for handling updates.
PuppyGraph is a graph computing engine that integrates with Redpanda. It works directly on the data lake, supports Apache Iceberg, and doesn't require ETL. When integrated with Redpanda's Iceberg topics, PuppyGraph allows for simple, high-speed graph queries and analysis of data streams without any ETL pipelines. As Redpanda continuously commits new data to Iceberg, graph queries in PuppyGraph automatically reflect the latest changes, ensuring that analytics and insights stay up to date with real-time events.
In December 2024, Redpanda released its native Apache Iceberg™ integration: Iceberg Topics. In addition to performing typical stream data processing, Iceberg Topics allows users to get a copy of the latest data in the designated data lake for subsequent data analysis of the streamed data.
PuppyGraph is proudly the first graph computing engine to integrate with Redpanda. As a graph computing engine, PuppyGraph doesn’t require ETL, can work directly on the data lake, and supports Apache Iceberg™. This means you can easily integrate Redpanda's Iceberg topics with PuppyGraph for simple, high-speed graph queries and analyze data streams without any ETL pipelines.
In this blog post, we show you how to integrate Redpanda's Iceberg topics with PuppyGraph for streamlined graph analysis. But first, let’s start with a brief overview of the technologies you’ll be using in the demo.
Iceberg is a revolutionary open-source table format that transforms how we manage data in data lakes. Originally created by Netflix in 2017 and later donated to the Apache Software Foundation, Iceberg addresses the limitations of traditional data lake formats while bringing warehouse-like capabilities to data lake storage.
What sets Iceberg apart is its user-friendly features like hidden partitioning, which removes the need for explicit partition columns, and partition evolution, which allows for changing partition schemes without rewriting data. The format supports both copy-on-write and merge-on-read strategies for handling updates, giving users flexibility in optimizing for their specific use cases.
As a vendor-neutral, open format, Iceberg works seamlessly with various compute engines and storage systems, making it a cornerstone technology for modern data lakehouses. This architecture combines the best of both worlds: the flexibility and cost-effectiveness of data lakes with the performance and reliability traditionally associated with data warehouses.
Redpanda's integration with Apache Iceberg introduces a powerful feature called Iceberg Topics, which bridges the gap between real-time streaming data and offline analytics. This functionality is designed to simplify how organizations harness their streaming data for analytics, enabling seamless integration with data lakehouse architectures.
The Iceberg integration uses Tiered Storage, so when a cluster or topic has Tiered Storage enabled, Redpanda stores the Iceberg files in the configured Tiered Storage bucket or container.

Incoming data is ingested and stored in Redpanda brokers, providing a typical log-based view for real-time processing through stream queries and transforms. With Iceberg Topics, Redpanda automatically exposes that same data in an Iceberg catalog, which can be accessed as a table. As Tiered Storage is built in, the data lives in both a streaming log format and a table format without any extra copying or ETL.
Analytics tools, such as Snowflake, Databricks, ClickHouse, Apache Spark™ and PuppyGraph, can then issue SQL queries against these table views just like any other data lake source.
PuppyGraph, as a graph analytics engine, enables users to query their data as a graph by directly connecting to their data warehouses and lakes without ETL. Combined with Iceberg Topics, it's a true no-ETL solution for performing real-time graph analytics.
As Redpanda continuously commits new data to Iceberg, graph queries in PuppyGraph automatically reflect the latest changes, ensuring that analytics and insights stay up to date with real-time events.
To better illustrate the power of Redpanda's streaming capabilities alongside PuppyGraph's graph analytics, we’ll create a graph processing pipeline for analyzing financial transaction data. To run it yourself, you can find the demo in this GitHub repository.
You can also refer to the Redpanda - Iceberg Docker Compose example as a prototype of Iceberg topics alone.
rpk: The Redpanda command-line tool for cluster administration, topic management, profiling, and more.Clone the repository of redpanda-labs.
git clone https://github.com/redpanda-data-blog/graph-analytics-iceberg-topics-puppygraph.gitStart the Docker Compose environment.
docker compose upThis command builds and launches all services defined in the Docker Compose file, including Redpanda, MinIO, a REST-based Iceberg Catalog service, a console for managing topics, Spark, and PuppyGraph.
Create and use an rpk profile.
 rpk profile create redpanda-puppygraph \
--set=admin_api.addresses=localhost:19644 \
--set=brokers=localhost:19092 \
--set=schema_registry.addresses=localhost:18081
 rpk profile use redpanda-puppygraph
Create schemas for Redpanda topics.
./script -cImport snapshot data.
./script -sThe -s option imports the snapshot data into Redpanda. You should see new topics appear in the Redpanda Console at http://localhost:8079/topics or via rpk topic list.
Log into the PuppyGraph Web UI at http://localhost:8081 with the following credentials:
Upload the schema. Select the file graph_schema.json in the Upload Graph Schema JSON section and click on Upload.

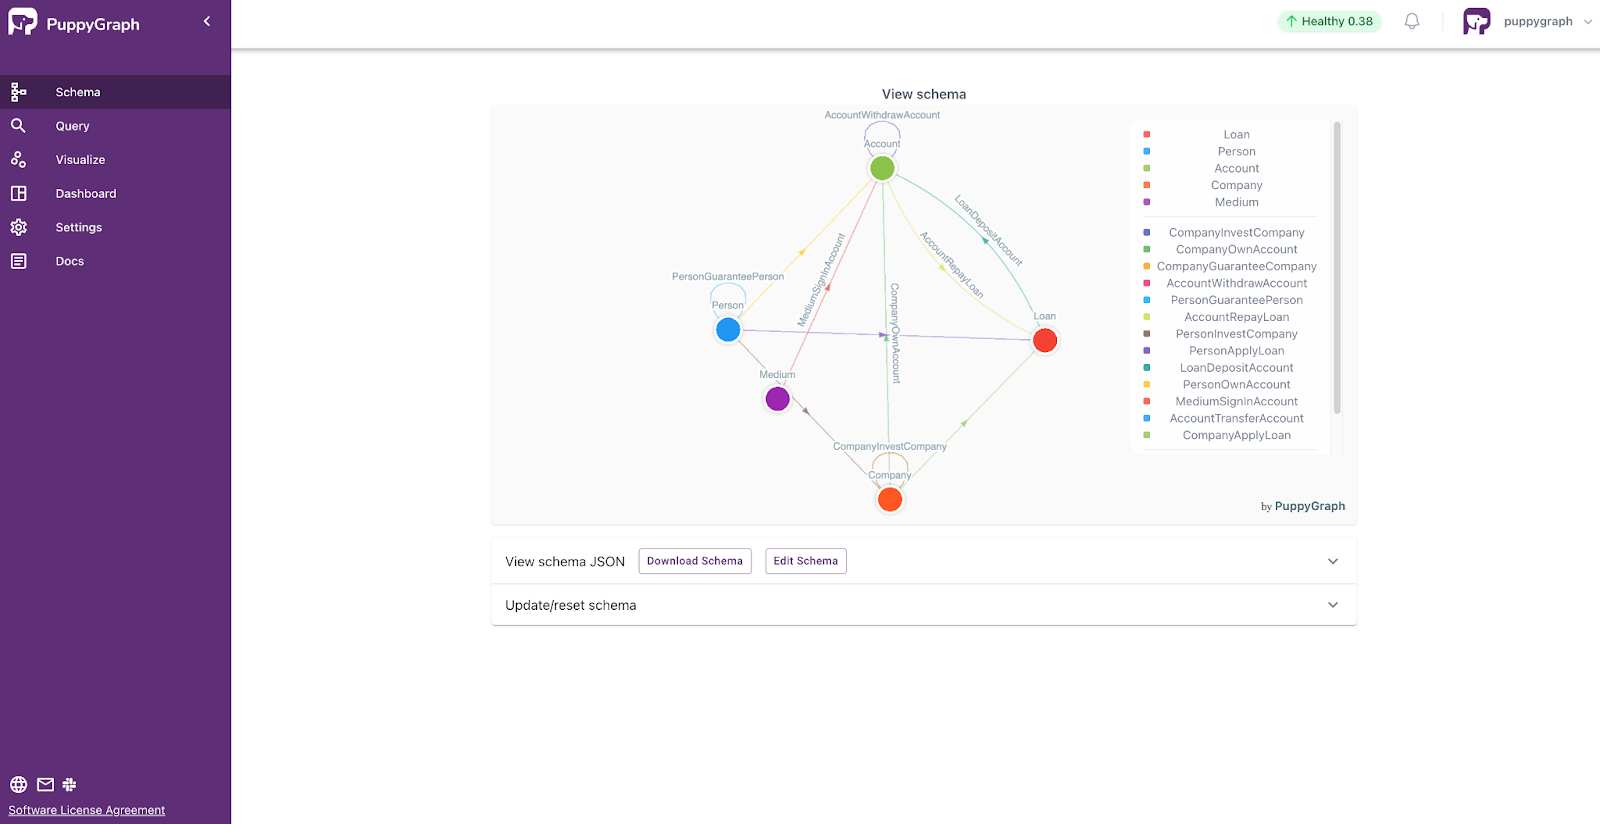
Now you can go to the Dashboard panel on the left side and see some basic information and visualization of the graph. You can also add your own tile.
Import incremental data.
./script.sh -iThe -i option imports the incremental data into Redpanda.
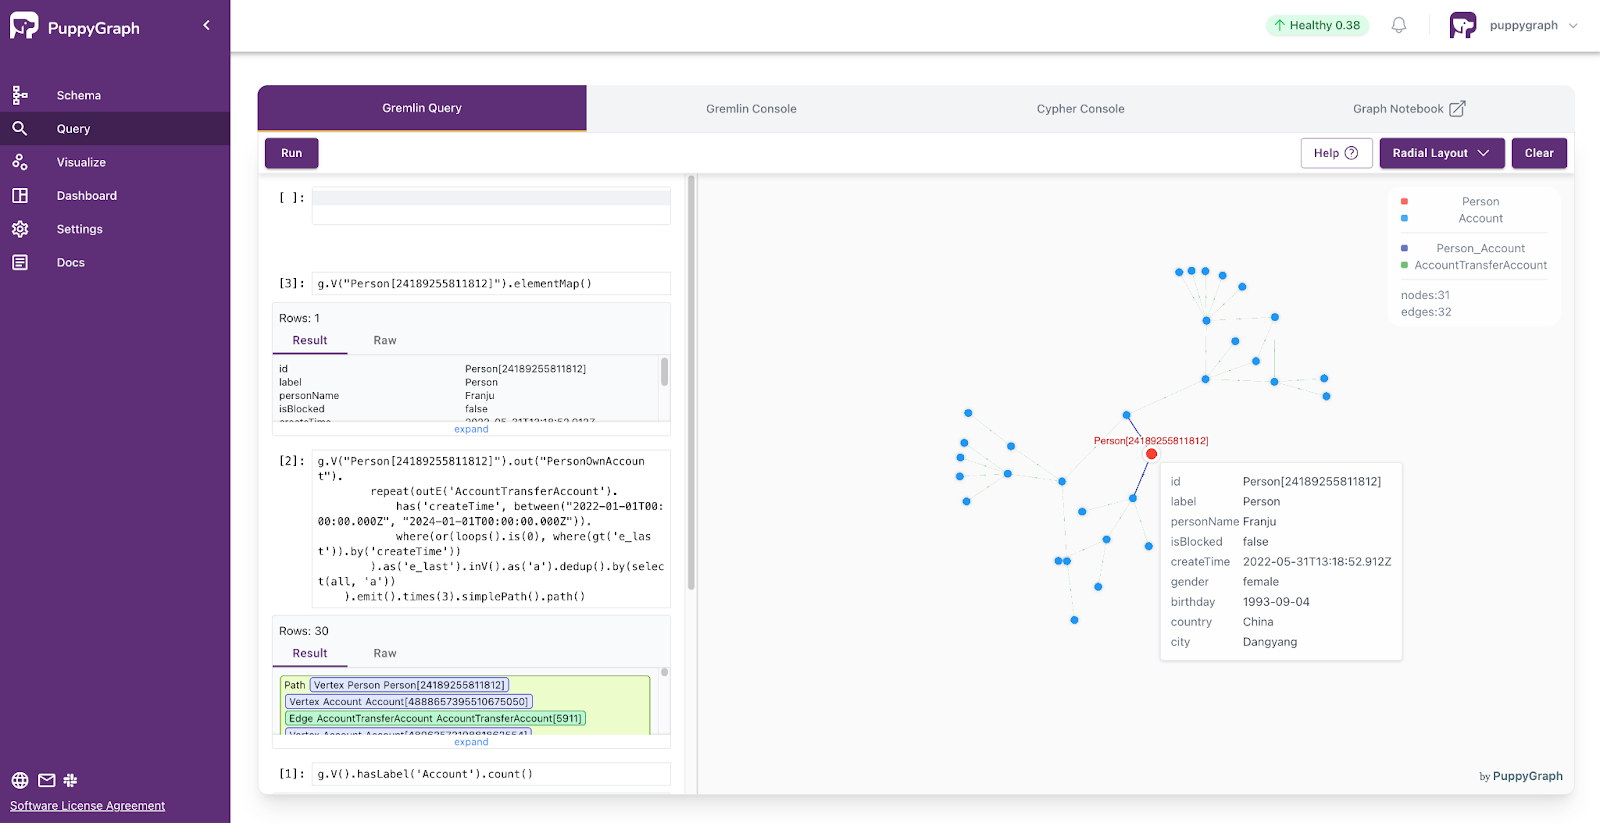
PuppyGraph supports querying with Gremlin and Cypher. Navigate to the Query panel on the left side. The Gremlin Query tab offers an interactive environment for querying the graph using Gremlin.
After each query, remember to clear the graph panel before executing the next query to maintain a clean visualization. You can do this by clicking the Clear button located in the top-right corner of the page. You will see the query results update as new data is produced.
Here are two example queries where we get the number of accounts.
g.V().hasLabel('Account').count()Given an account, find the sum and max of fund amount in transfer-ins and transfer-outs between them in a specific time range between startTime and endTime.
    g.V("Account[268245652805255366]").as('v').
        project('outs', 'ins').
            by(select('v').outE('AccountTransferAccount').has('createTime', between("2022-01-01T00:00:00.000Z", "2024-01-01T00:00:00.000Z")).fold()).
            by(select('v').inE('AccountTransferAccount').has('createTime', between("2022-01-01T00:00:00.000Z", "2024-01-01T00:00:00.000Z")).fold()).
        project('sumOutEdgeAmount', 'maxOutEdgeAmount', 'numOutEdge',
        'sumInEdgeAmount', 'maxInEdgeAmount', 'numInEdge').
            by(select('outs').coalesce(unfold().values('amount').sum(), constant(0))).
            by(select('outs').coalesce(unfold().values('amount').max(), constant(-1))).
            by(select('outs').coalesce(unfold().count(), constant(0))).
            by(select('ins').coalesce(unfold().values('amount').sum(), constant(0))).
            by(select('ins').coalesce(unfold().values('amount').max(), constant(-1))).
by(select('ins').coalesce(unfold().count(), constant(0)))MATCH (x:Account) RETURN count(x)You can see more example queries in the GitHub repository.
To stop and remove the containers, networks, and volumes, run:
sudo docker compose down --volumes --remove-orphansIn this blog, we explored integrating Redpanda's Iceberg topics with PuppyGraph's zero-ETL graph query engine for real-time graph analysis. This streamlined approach simplifies workflows and enables high-speed graph queries, removing the complexities often encountered with traditional graph technologies.
Ready to build a future-proof, graph-enabled real-time system? Visit PuppyGraph (forever free developer edition) and sign up for a free trial of Redpanda to get started!
Subscribe to our VIP (very important panda) mailing list to pounce on the latest blogs, surprise announcements, and community events!
Opt out anytime.