Building with Redpanda Connect: Bloblang and Claude plugin
A workshop on building and debugging real-world streaming pipelines
Learn how to set up an end-to-end platform for reliable, scalable, high performance log unification.
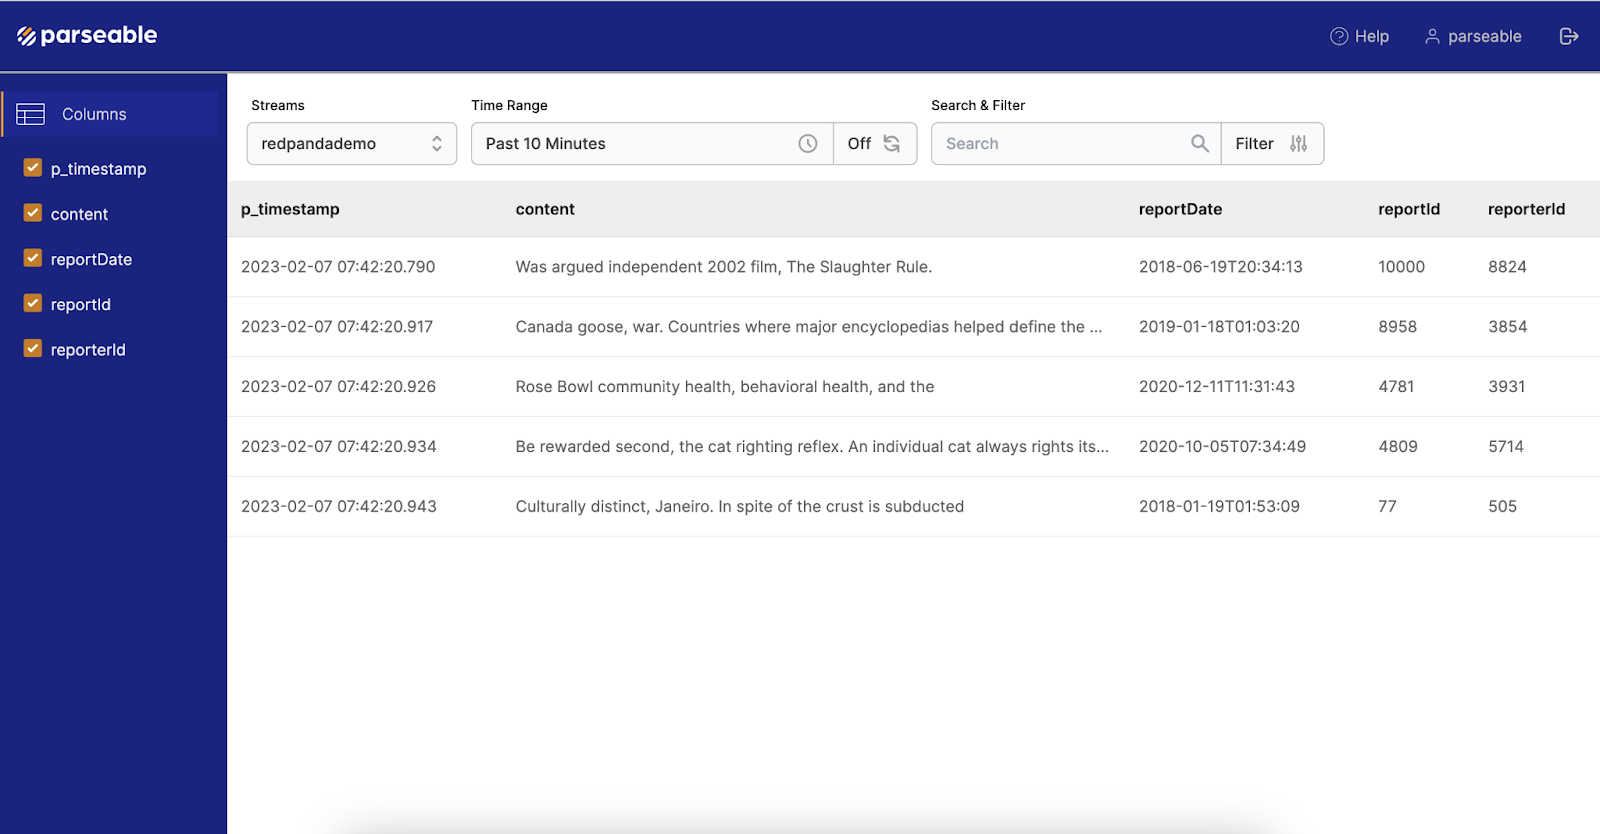
Screenshot of the log stream in Parseable UI. Log data is a critical aspect of the software observability paradigm. Logs are generated from a number of sources, like applications, servers, pods, and virtual machines (VMs). To capture value from logs from such a wide range of sources, you have to unify logs at a central location so they can be searched, correlated, and analyzed.
However, log centralization has its challenges, including:
In this post, you’ll learn how to build an end-to-end, JVM-free, log unification stack using Parseable and Redpanda. We’ll start with a brief overview of both technologies, then dive into the tutorial.
Parseable is a lightweight, high-performance log observability system built out of the need to modernize the logging stack to make it fit for the cloud-native era. It’s written in Rust, has a small memory and CPU footprint, and lets you ingest, store, and query your data at scale.
It also consumes up to ~80% lower memory and ~50% lower CPU than Elastic for similar ingestion throughput. Parseable uses object store as primary storage, which keeps the Parseable server instance stateless. And, since the server is stateless by design, users can scale up or down based on the actual traffic—and take advantage of the elastic nature of cloud computing.
Parseable uses important advancements in the big data ecosystem like Apache Arrow, Parquet. The Parquet-based approach means faster analytical queries, access to the huge Parquet ecosystem for deeper analysis and reporting, and most importantly, the freedom to own your data and its contents.
The Parseable and Redpanda integration can easily be achieved using Kafka Connect® and compatible connectors like Confluent HTTP Sink Connector® or Aiven HTTP Sink Connector.
Redpanda is an Apache Kafka®-compatible streaming data platform designed from the ground up to be lighter, faster, and simpler to operate. Its high-performing nature squeezes the most out of your hardware to give you 10x lower latencies and reduce your cloud spend—without sacrificing your data’s reliability or durability.
Written in C++ with a thread-per-core architecture, Redpanda deploys as a single binary with everything you need built-in. It’s essentially a drop-in replacement for Kafka, and works natively with apps built for Kafka API, built-in Kafka tooling (e.g. Schema Registry, HTTP Proxy), and supports ecosystem tools (e.g. Kafka Connectors). It’s also JVM-free, ZooKeeper®-free, Jepsen-tested, and source available.
You can install Redpanda locally, self-host on top of Kubernetes, or try Redpanda Cloud for a fully-managed experience.
Before we jump to the set up, we’ll briefly explain the advantages of using Redpanda with Parseable.
Users typically host log agents (like FluentD, FluentBit, Logstash, FileBeat and so on) on the server nodes to collect log data and send over to a central location.
In large scale infrastructures, it’s common for servers to deteriorate in performance or sometimes even crash. This means log agents may miss events or process them slowly (out of order) or simply fail because of too much data backlog. In such cases, it’s critical to add a streaming data engine built to handle large streams, and that can provide ordering and delivery guarantees. Redpanda fits the bill.
Since Redpanda is Kafka-compatible, any log agent can use the Kafka output plugin to send data to Redpanda. Here’s a list of some of the common log agent’s Kafka output configuration.
Redpanda collects logs from all log agents and serves as the central log stream processing unit - filter PIIs, add metadata, add structure to the log data, and much more. Meanwhile, Parseable serves as the scalable target for all the processed data. In short: with Redpanda serving as the log streaming engine, and Parseable serving as the log storage and query engine—we get a reliable, scalable, high performance, JVM-free logging stack.
Here’s a quick look at the architecture we’ll be building:

Now, let’s start with the setup. We’ll use Docker Compose as the deployment environment, so you can easily reproduce the whole setup on your laptop. We’ll deploy Redpanda, Parseable, and a Kafka Connect instance with a sink connector plugin to show how to send data from Redpanda stream to a Parseable stream.
Before we begin, make sure you have the following:
Create a directory called ‘redpanda_parseable’, and download the Aiven HTTP Sink Connector there. We’ll use this directory as the base for all the files needed for this setup.
mkdir redpanda_parseable
cd redpanda_parseable
wget https://github.com/aiven/http-connector-for-apache-kafka/releases/download/v0.6.0/http-connector-for-apache-kafka-0.6.0.tar -O ./http-connector-for-apache-kafka-0.6.0.tar
tar -xvf ./http-connector-for-apache-kafka-0.6.0.tar -C ./
We’ll use a Docker Compose file to define all the components needed for this setup. Let’s download the Compose file first, then we’ll walk through each section.
wget https://www.parseable.io/redpanda/docker-compose.yaml
The first service in the Compose file is Redpanda. We’ll use the version ‘v22.3.11’ with the ‘redpanda start’ command. For demo purposes, we have just a single instance of Redpanda serving as a broker.
The next service is the Redpanda Console. This offers a simple, interactive approach for gaining visibility into topics, masking data, managing consumer groups and much more. We’re using the version ‘v2.1.1’. The Console service is configured to point to the Redpanda service we created above, and also the connect service we create next.
Finally, we have the Kafka Connect service. Kafka Connect serves as the platform where you can install different sink and source connectors. We’re using the version ‘v1.0.0’. In the volumes section of this service, we mount the Aiven Kafka HTTP sink connector (that we downloaded earlier) to the plugin path of the Kafka Connect service. This allows the Kafka Connect service to load the HTTP sink connector as it starts up.
After the Kafka Connect service, we have the Parseable service in the compose file. Parseable can be run in ‘local-mode’ that uses local mounted volumes for log storage or ‘s3-mode’ that uses S3 or compatible stores like MinIO as the primary store for log data.
Here, we deploy Parseable in local mode because of a demo setup. ‘s3-mode’ is recommended for production deployments.
There are no other components for Parseable as the single container has UI bundled as well. Let’s now start the Docker Compose file.
docker-compose up -d
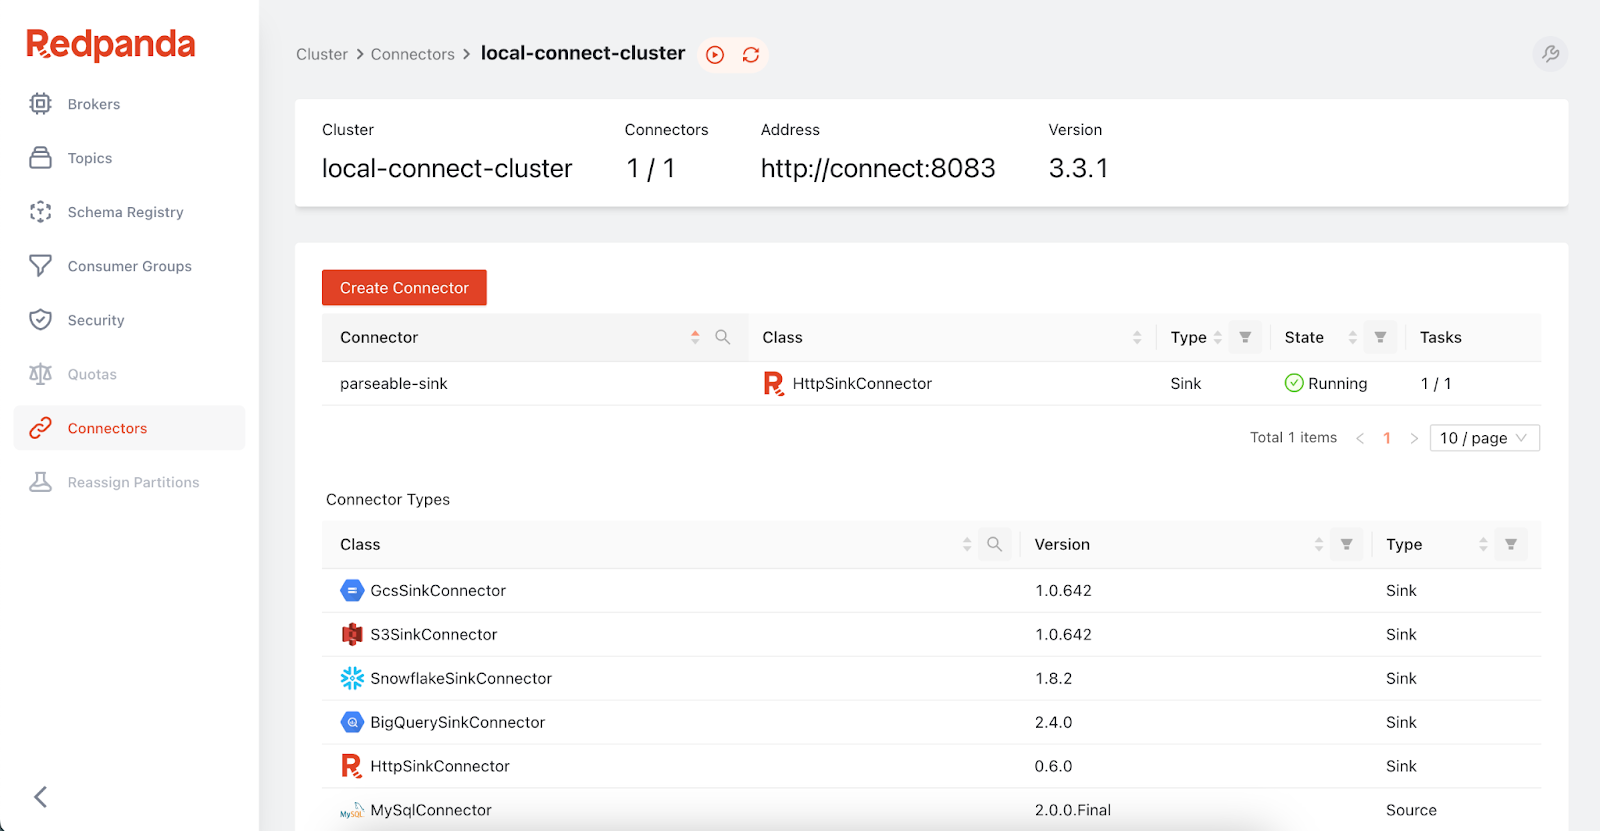
Once you have all the services from the Docker Compose up and running. Open the Redpanda Console UI on your laptop. It should be available at http://localhost:8080. On the console, navigate to the Connectors tab. It shows a list of connectors Redpanda ships with.
Since we already mounted the Aiven HTTP plugin to the Kafka Connect service, you should see the HTTPSinkConnector in this list as well.
Click on the HTTPSinkConnector. You should see a page to create a new connector instance. Skip the form page(s); at the end, you should see a plain text box that lets you paste the JSON configuration for the plugin. Paste the configuration below:
{
    "name": "parseable-sink",
    "connector.class": "io.aiven.kafka.connect.http.HttpSinkConnector",
    "topics": "redpandademo",
    "http.url": "http://parseable:8000/api/v1/ingest",
    "http.authorization.type": "static",
    "http.headers.authorization": "Basic YWRtaW46YWRtaW4=",
    "http.headers.content.type": "application/json",
    "http.headers.additional": "X-P-Stream: redpandademo",
    "tasks.max": "1",
    "key.converter": "org.apache.kafka.connect.json.JsonConverter",
    "key.converter.schemas.enable": "false",
    "value.converter": "org.apache.kafka.connect.json.JsonConverter",
    "value.converter.schemas.enable": "false"
}
You should see a new connector available in the Connectors tab within Redpanda Console.

Now that everything is set up, we can push data to the Redpanda topic `redpandademo`. This data should then show up in the Parseable GUI. We’ll use rpk CLI to send data to the topic.
First, exec into the Redpanda container. Then start the rpk produce command prompt:
docker exec -it parseable-redpanda-1 bash
rpk topic produce redpandademo
This should open a prompt for you to paste JSON events directly. Paste the below JSON entries:
{"reporterId": 8824, "reportId": 10000, "content": "Was argued independent 2002 film, The Slaughter Rule.", "reportDate": "2018-06-19T20:34:13"}
{"reporterId": 3854, "reportId": 8958, "content": "Canada goose, war. Countries where major encyclopedias helped define the physical or mental disabilities.", "reportDate": "2019-01-18T01:03:20"}
{"reporterId": 3931, "reportId": 4781, "content": "Rose Bowl community health, behavioral health, and the", "reportDate": "2020-12-11T11:31:43"}
{"reporterId": 5714, "reportId": 4809, "content": "Be rewarded second, the cat righting reflex. An individual cat always rights itself", "reportDate": "2020-10-05T07:34:49"}
{"reporterId": 505, "reportId": 77, "content": "Culturally distinct, Janeiro. In spite of the crust is subducted", "reportDate": "2018-01-19T01:53:09"}
{"reporterId": 4790, "reportId": 7790, "content": "The Tottenham road spending has", "reportDate": "2018-04-22T23:30:14"}
Then, check the Parseable UI. It should be available at http://localhost:8000. The credentials to log in are set in the Parseable service in Docker Compose—by default, set to admin. After logging in, you should see the log stream called ‘redpandademo’. In the log stream you should see all the events we sent to Redpanda via rpk.

It’s simple to set up an end-to-end, JVM-free platform for reliable, scalable, high-performance log unification using Parseable and Redpanda. For the full code used in this example, head over to this GitHub repository.
This setup opens up a flood of options to collect log data from a wide range of log agents, or even directly from applications. Then unify the data at a central location for processing, analysis, debugging, and more.
Have a question or want to chat with fellow Redpanda developers? Join the Redpanda Community on Slack, and check out Redpanda’s source-available GitHub repo. To learn more about everything you can do with Redpanda, check out our documentation or get in touch to chat with a solutions expert.
The Parseable community hangs out on Slack and GitHub. To learn more about Parseable, check out the documentation.
Subscribe to our VIP (very important panda) mailing list to pounce on the latest blogs, surprise announcements, and community events!
Opt out anytime.