
Bridge Queries in Redpanda SQL
Have your real-time cake and eat your analytics too
How we introduced sampling memory profiler into Seastar to debug and fix issues in Redpanda faster


The sampling memory profiler only records information about a fraction of all allocations. The advantage of this approach is that the profiler's overhead can be tuned based on the sampling frequency. If the cost of determining whether to take a sample can be made very small, then the overall overhead of the profiler can approach zero as the sampling frequency is reduced.
The Seastar memory allocator groups allocations into small (up to 32KiB) and large allocations. Small allocations are grouped into various size classes and handled by an object pool per class which carves the smaller allocations out of larger chunks which allocate less frequently. Large allocations are tracked separately and are composed of one or more memory pages that divide the memory space. Each page has metadata associated with it.
The drawback of using the Seastar framework is that it does not enjoy the benefits of virtual memory, and many pre-existing memory analysis tools don’t work out of the box with it.
The sampled heap memory profiler introduced into Seastar allows for very low overhead allocation tracking. It can be used in an always-on fashion in production workloads, which greatly helps in debugging and fixing problems in Redpanda that occur first in real-life workloads and are hard to reproduce.
Redpanda uses the Seastar framework, a C++ thread-per-core architecture with its own memory allocator. This framework overrides the default C and C++ allocation methods, allowing it to tune memory allocations for the thread-per-core architecture and make allocations very efficient.
Redpanda is written using the C++ Seastar framework, a thread-per-core architecture with its own memory allocator, overriding the default C and C++ allocation methods. This approach allows the framework to tune memory allocations for the thread-per-core architecture and can make allocations very efficient.
One drawback is that we no longer enjoy the benefits of virtual memory, and many pre-existing memory analysis tools don’t work out of the box.
To find out which parts of the application are the main memory guzzlers, Seastar offers a heap memory profiler. This captures the backtrace of every allocation for later analysis. However, it comes at a steep performance cost and is unusable in production.
In this blog post, we introduce the sampled heap memory profiler into Seastar, which allows very low overhead allocation tracking and can be used in an always-on fashion in production workloads. This greatly helps us debug and fix problems in Redpanda that occur first in real-life workloads and are hard to reproduce.
Here’s how we did it.
A sampling memory profiler only records information about a fraction of all allocations. The advantage of this approach is that we can tune the profiler's overhead based on the sampling frequency. If the cost of determining whether to take a sample can be made very small, then the overall overhead of the profiler can approach zero as we reduce the sampling frequency.
The sampling interval is a count of bytes, after which we take a sample. To avoid bias around allocation patterns in the application that might align with a static interval, we instead employ a dynamic interval that is randomized every time a sample is taken.
To achieve this pseudo-randomization, each allocated byte is modeled as having an equal chance of being sampled, so each byte can be seen as a Bernoulli trial (flipping a biased coin). Performing such a test for each byte would be very expensive. You can model such Bernoulli trials as a Poisson process. This in turn allows us to draw samples directly from the distribution of the interarrival times between two samples (how many bytes until we sample the next allocation) using an exponential distribution.
After taking the sample, the statically configured sampling interval is fed into the exponential distribution as its rate parameter, resulting in the “bytes to next sample.” This replaces the per-byte trial with a simple counter that counts down allocated bytes until the next sample. Querying the exponential distribution only occurs when a sample is taken and is fairly cheap.
The above process is based on and shares code with the Android heapprofd memory profiler.
With the sampling in place, there’s another aspect of the profiler to address: we don’t want to sample historical allocation sites. Instead, we want to view the current set of live allocations. This is important because it allows us to analyze the biggest active memory consumers: the most frequent allocation sites don’t necessarily correlate with the highest ongoing memory use, as many allocations are very short-lived.
To implement this, we tracked only the live subset of the sampled allocations. When an allocation is freed we stop tracking it. So for every allocation, we needed to track whether it was sampled or not, so on deallocation, we could update our tracking data structure. Associating an extra flag with each allocation (e.g., at a fixed negative offset to the pointer returned by malloc) would add too much memory overhead, especially for smaller allocations that are very frequent.
To solve this, we took two different approaches depending on the size of the allocation. But first, we had to understand some of the internals of the Seastar memory allocator.
The allocator groups allocations into small (allocations up to 32KiB) and large allocations. Small allocations are grouped into various size classes and handled by an object pool per class which carves the smaller allocations out of larger chunks which allocate less frequently. When a small object is freed we can map it back to the pool it was allocated from based on its address. Large allocations are tracked separately and are composed of one or more memory pages (not to be confused with the memory pages of the OS) that divide the memory space. Each page has metadata associated with it.
Given that implementation, let’s get into the approaches.
Each sampled allocation is attributed to a call site, which is identified by its full backtrace at the moment of allocation. This is very similar to what a CPU profiler does. We track and group allocations by their call site, making it remarkably easy to tell how much memory has been allocated by a certain piece of code.
With the profiler in place, we also extended Seastar to query the sampled live memory set at runtime and export it from Redpanda via an HTTP API.
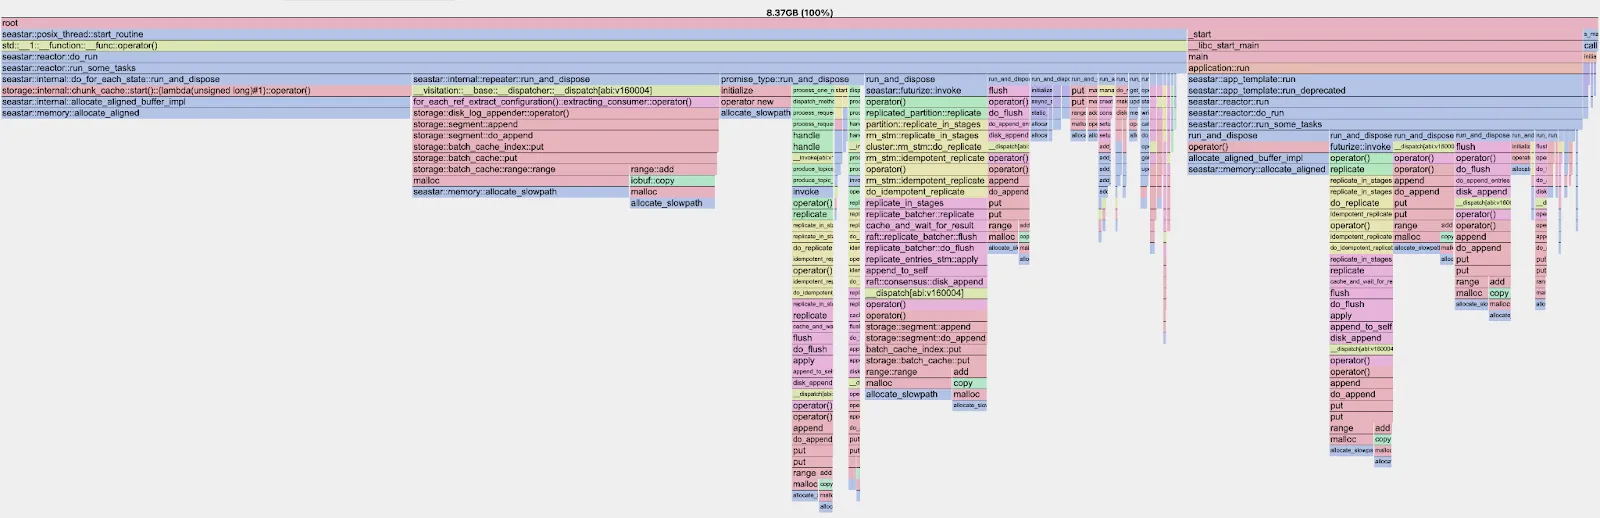
This way, we can view which components are using memory at runtime and export the information in different formats. For example, we can create a flame graph showing the allocated memory.
While this API is excellent for development, it’s not useful after Redpanda runs into an out-of-memory (OOM) scenario, as the process crashes at that point. The memory profiler can, however, also help with that.
When the Seastar allocator fails to allocate memory, it prints certain debug information that might help debug the root cause, such as the sizes of its internal object pools or the stack trace of the allocation that caused the OOM. While this stack trace is sometimes useful, we’ve observed that when running out of memory, the failing allocation is often not linked to the actual root cause. There are likely several other objects already allocated and hogging memory but often it’s an unrelated large allocation that eventually fails when memory is almost exhausted.
The memory profiler solves this problem. Seastar allows customizing the OOM debug output, so we can query the sampled live memory set from the profiler at OOM time and print the current top allocation sites by memory usage.
We get an output such as the following.
Top-N alloc sites:
size: 885010915 count: 295 at: 0x88df718 0x88d2fff 0x88a28c3 ...
size: 489006031 count: 163 at: 0x88de6b0 0x88d2fec 0x88a28c3 ...
size: 453005587 count: 151 at: 0x88de6b0 0x88d2fd9 0x88a28c3 ...
size: 276003404 count: 92 at: 0x9a33f0a 0x96b8920 0x96a1207 ...
size: 135001665 count: 45 at: 0x8abd9df 0x2ecc1fa 0x976ce9f ...
...
The size column estimates how much memory has been allocated at the given call site, while the count shows the number of samples we took. The final column is the series of addresses that make up the backtrace at the allocation site. This way, allocations are grouped even if there are multiple allocations of different sizes. Using additional tooling, we can easily translate this output to full stack traces.
One of the main goals of the sampling profiler was to run it in an always-on fashion in production. The adjustable sampling frequency allows for that. Currently, we default to a 3MB sampling frequency in Redpanda, which allows us to run with no measurable performance overhead.
While 3MB sounds fairly large, it works very well in practice. When we end up in OOM situations, only a few allocation sites account for most of the memory bloat, which is caused by localized bugs.
The cost of taking a sample is mostly dominated by unwinding the stack and actually getting a backtrace. There’s further overhead from sampling the exponential distribution, though the latter is close to negligible. It’s in the range of tens of nanoseconds.
The overhead when not taking a sample is very low. As described previously, all we do to see whether we take a sample is decrease our current sampling interval by the size of the current allocation and check whether we’ve exhausted it. This results in very simple code to check whether we have to sample an allocation.
bool maybe_sample(size_t alloc_size) {
    return (interval_to_next_sample_ -= alloc_size) < 0;
}
The above translates to added instruction counts in the lower single digits. Even though the overhead is minimal, we further optimized the Seastar allocator in other places so the allocate and free paths are overall faster than before. This was mostly done by rearranging the code and adding compiler hints for inlining and branch layout, resulting in better code generation.
We can look at the results of a combined new and delete micro-benchmark:
With our improvements, we see a clear reduction in instruction count! Even with the added overhead of the sampling logic, we’re still faster than before. While instruction count isn’t always a good indicator of runtime performance, we also see a similar picture when looking at execution times instead of instruction count.
Since introducing the sampling memory profiler, it has been tremendously helpful in speeding up the investigation and fixing of OOM issues. It can immediately point to the root cause and avoids having to guess the main memory consumers based on subtle hints in the logs or metrics.
We have since also merged all the code changes to upstream Seastar, so if you’re a Seastar user you can also benefit! The code is fully platform-independent and works on both Arm and x86-based instances.
To read more about what Redpanda engineers are working on, chat with us in the Redpanda Community on Slack.
Subscribe to our VIP (very important panda) mailing list to pounce on the latest blogs, surprise announcements, and community events!
Opt out anytime.