Full CDC semantics land in the Iceberg output for Redpanda Connect
Your lakehouse mirrors the database, instantly.
The simplest way to handle large-scale data processing and visualization with Redpanda, Propel's Serverless ClickHouse, and Next.js


In the tutorial, you'll learn how to ingest data from Redpanda into Propel's Serverless ClickHouse, use Propel's API layer, and create dashboards using Propel's embeddable components in a Next.js app. This can be applied to various real-world use cases, including usage tracking, insights features, and observability applications. You'll build a live dashboard for an imaginary SaaS business, create a topic in Redpanda, connect it to Propel, and expose the data via APIs to your dashboard in Next.js.
To materialize the query into a table that updates in real time as new data arrives, you can create a Materialized View in Propel. This allows you to have a structured table that is automatically updated with new data as it is ingested.
First, create a user in Redpanda for Propel to connect to your cluster. Then, grant the Propel user DESCRIBE and READ access to the orders topic, and DESCRIBE, READ, and DELETE on consumer groups that start with “propel-”. Next, log in to the Propel Console, go to Data Pools, then click Create Data Pool. Then select Kafka. Add your Redpanda credentials and select the topic you want to ingest.
You can go to the SQL Console in the Propel Console and enter a query to flatten the different JSON keys into individual columns. This allows you to analyze the data in a more structured format.
To complete the tutorial, you'll need a Redpanda Serverless account, have the Redpanda CLI installed, a Propel Serverless ClickHouse account, and Node.js 18.18 or later.
Building real-time dashboards that are fast, scalable, and capable of handling large numbers of concurrent users is a complex challenge. Traditional methods using data warehouses or transactional databases with embedded business intelligence (BI) tools often fall short due to issues with data freshness, query latency, and a rocky user experience.
In this tutorial, you'll learn how to ingest real-time data with Redpanda Serverless and stream it to Propel's Serverless ClickHouse. You'll also learn how to perform fast queries on this streaming data and visualize it in a Next.js application.
A real-time dashboard provides users with the most current data, presented with minimal delay, ensuring decisions can be made based on the freshest insights. Here are a few use cases where real-time dashboards have the most impact:
{indent}
Real-time dashboards play a crucial role in monitoring product usage, offering instant insights to customers on how the product is performing for them. Courier, a notifications API platform, exemplifies this by offering developers real-time usage metrics. This data lets developers quickly identify the most effective communication channels and optimize their notification strategies.
Real-time dashboards are indispensable for businesses focused on operational efficiency. Lumeo, a computer vision analytics startup, uses real-time dashboards to provide enterprises with analytics on computer vision models running live CCTV video streams. These dashboards offer a clear, up-to-the-minute view of physical locations, enabling enterprises to monitor performance, identify bottlenecks, and make informed decisions to enhance operations.
In observability, real-time dashboards are key to maintaining system performance and reliability. A great example is PlanetScale’s Query Insights. This tool offers an in-depth look at all active queries running against a database, helping users identify issues like long-running queries, excessive data returns, and errors. With real-time data, users can immediately detect when a query starts causing problems, trace it back to the specific moment and deployment that impacted it, and take swift action to resolve the issue.
Real-time dashboards are also crucial for tracking and understanding user engagement. Platforms like TikTok leverage real-time data to provide creators with up-to-date insights into how their content is performing. Metrics like video views, profile views, likes, comments, shares, and unique viewers are tracked in real time, enabling creators to evaluate the success of their content instantly and adjust their strategies accordingly.
In summary, real-time dashboards are crucial for delivering immediate, actionable insights across various use cases. Whether it's monitoring product usage, optimizing operations, ensuring system observability, or tracking engagement, the ability to access and act on the latest data can make or break a product's success.
{indent}
In this tutorial, we'll use the following technologies:
You'll learn how to ingest data from Redpanda into Propel's Serverless ClickHouse, use Propel's API layer, and create dashboards using Propel's embeddable components in a Next.js app. This can be applied to various real-world use cases, including usage tracking, insights features, and observability applications.
We'll build a live dashboard for TacoSoft, an imaginary SaaS business that helps taquerias track their orders. We'll create a topic in Redpanda, connect it to Propel, and expose the data via APIs to our dashboard in Next.js. To showcase the real-time capabilities of our dashboard, we'll generate live data throughout the process.
To complete the tutorial, you'll need the following:
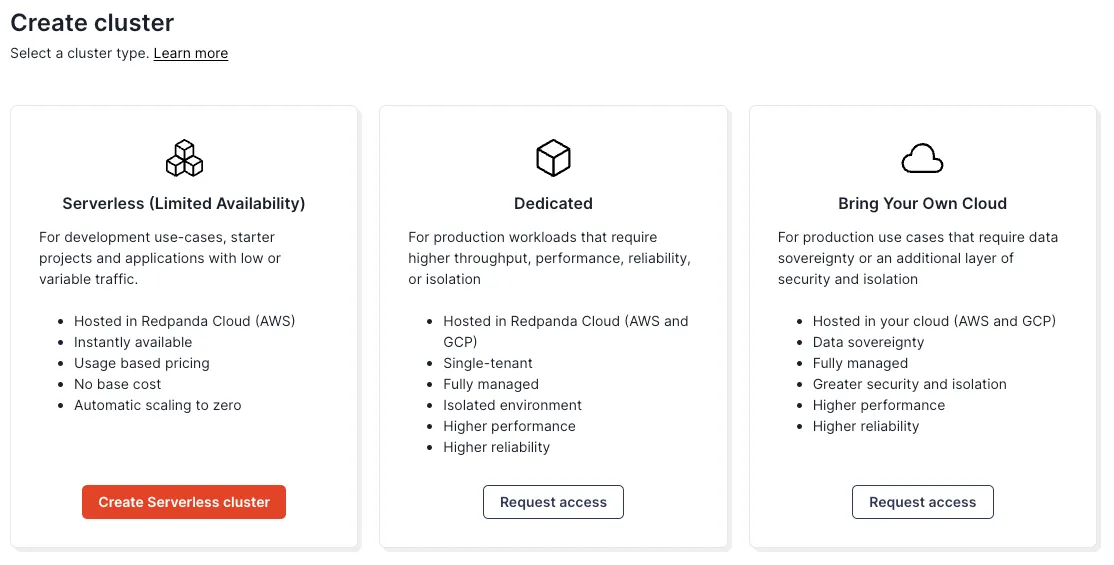
First, to create a serverless cluster, log in to the Redpanda Cloud, click on Clusters, and then on Create Serverless cluster.
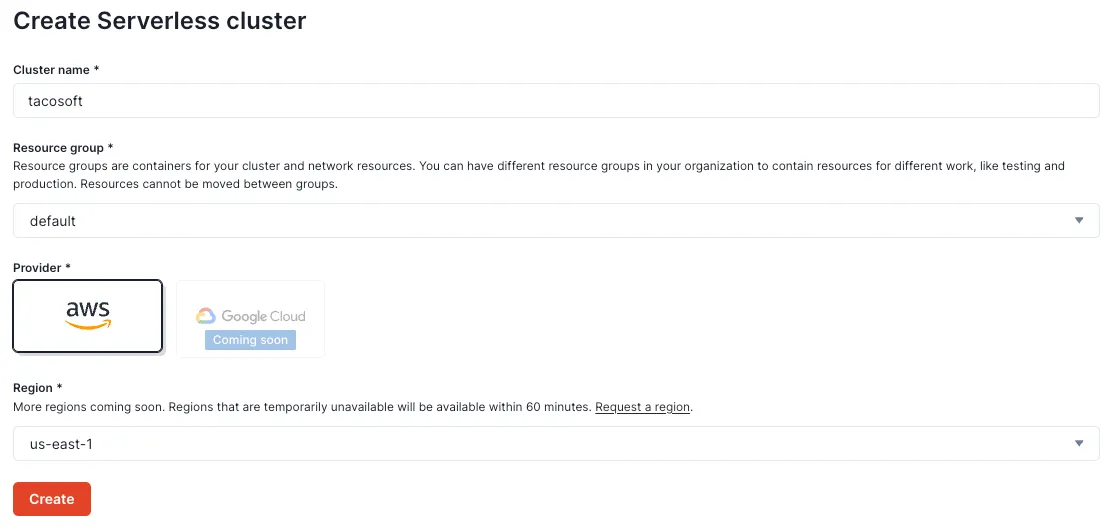
Give your cluster a name, “tacosoft,” for example, select a cloud and a region.
Log in to the Redpanda Cloud using the CLI:
rpk cloud loginSelect the “tacosoft” cluster you just created.
Which cloud resource-group/cluster would you like to talk to?  [Use arrows to move, type to filter]
> default/tacosoft
Create an “orders” topic with the following command:
rpk topic create ordersYou should get:
TOPIC   STATUS
orders  OK
Produce a message
echo '{"customer_id": 5, "order_id": 34, "store_id": 4445, "restaurant_name": "La Taqueria", "order_details": {"taco_name": "Carnitas Taco", "taco_count": 7, "total_price": 25.90, "checkout_time": "'$(date -u +"%Y-%m-%dT%H:%M:%SZ")'"}, "created_at": "'$(date -u +"%Y-%m-%dT%H:%M:%SZ")'"}' | rpk topic produce ordersYou should get
Produced to partition 0 at offset 0 with timestamp 1723504867867.Now let’s try to consume that message to make sure our Redpanda topic is working properly.
rpk topic consume ordersAnd this returns:
{
  "topic": "orders",
  "value": "{\"customer_id\": 5, \"order_id\": 34, \"store_id\": 4445, \"restaurant_name\": \"La Taqueria\", \"order_details\": {\"taco_name\": \"Carnitas Taco\", \"taco_count\": 7, \"total_price\": 25.90, \"checkout_time\": \"2024-08-08T12:34:56Z\"}, \"created_at\": \"2024-08-08T12:05:21Z\"}",
  "timestamp": 1723504867867,
  "partition": 0,
  "offset": 0
}
Now we see our first message in the topic!
Next, we’ll use a script to generate 100 messages of sample data. First, create a folder for our project,
mkdir -p redpanda-propel-tutorial/data-generator && cd redpanda-propel-tutorial/data-generatorSave the following script to the generate_messages.sh file:
#!/bin/bash
# Function to generate a random price
random_price() {
    echo $(printf "%.2f" "$(echo "$((RANDOM % 20 + 10)).$((RANDOM % 100))" | bc)")
}
# Function to generate a random taco count
random_taco_count() {
    echo $((RANDOM % 10 + 1))
}
# Array of restaurant names
restaurants=("La Taqueria" "El Farolito" "Taqueria Cancun" "Tacolicious" "Tropisueño")
# Array of taco names
tacos=("Carnitas Taco" "Carne Asada Taco" "Al Pastor Taco" "Pollo Taco" "Vegetarian Taco")
# Produce 1000 messages
for i in {1..100}; do
    customer_id=$((RANDOM % 1000 + 1))
    order_id=$((RANDOM % 10000 + 1))
    store_id=$((RANDOM % 5000 + 1))
    restaurant_name=${restaurants[$RANDOM % ${#restaurants[@]}]}
    taco_name=${tacos[$RANDOM % ${#tacos[@]}]}
    taco_count=$(random_taco_count)
    total_price=$(random_price)
    current_timestamp=$(date -u +"%Y-%m-%dT%H:%M:%SZ")
    json_message=$(echo '{"customer_id":'$customer_id',"order_id":'$order_id',"store_id":'$store_id',"restaurant_name":"'$restaurant_name'","order_details":{"taco_name":"'$taco_name'","taco_count":'$taco_count',"total_price":'$total_price',"checkout_time":"'$current_timestamp'"},"created_at":"'$current_timestamp'"}')
    echo $json_message | rpk topic produce orders
done
Make your script executable by running the following command:
chmod +x generate_messages.shRun your script by executing:
./generate_messages.shIf you log into Redpanda Console, you should see 101 messages in the topic. One for the test we did earlier and 100 from the script.

First, we need to create a user in Redpanda for Propel to connect to your cluster.
rpk acl user create propel --password '<YOUR_SUPER_SECURE_PASSWORD>' --mechanism SCRAM-SHA-256Replace <YOUR_SUPER_SECURE_PASSWORD> with a secure password.
Then, we need to grant the Propel user DESCRIBE and READ access to the orders topic, and DESCRIBE, READ, and DELETE on consumer groups that start with “propel-”
rpk acl create --allow-principal 'User:propel' --operation describe --operation read --topic orders
rpk acl create --allow-principal 'User:propel' --operation describe --operation read --operation delete --resource-pattern-type prefixed --group 'propel-'
Lastly, to verify the user setup, run:
rpk acl list --topic ordersYou should see the ACLs you added for the user "propel".
Next, log in to the Propel Console, go to Data Pools, then click Create Data Pool. Then select Kafka.

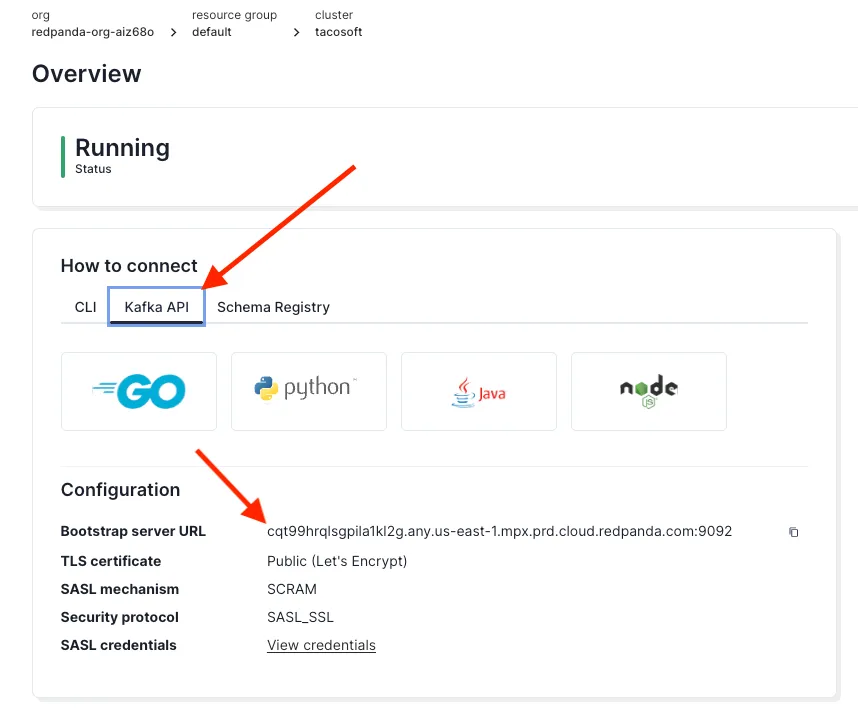
Then click on Add credentials and add your Redpanda credentials. You can find the Bootstrap server URL in the Redpanda Console under your topic’s Overview section.
Back in the Propel Console, once you click Create and test credentials, you’ll see the “CONNECTED” status.

After you click Next, you'll see the topic this user has access to. In our case, the “orders” topic.

Select the topic you want to ingest. In our case, “orders”.

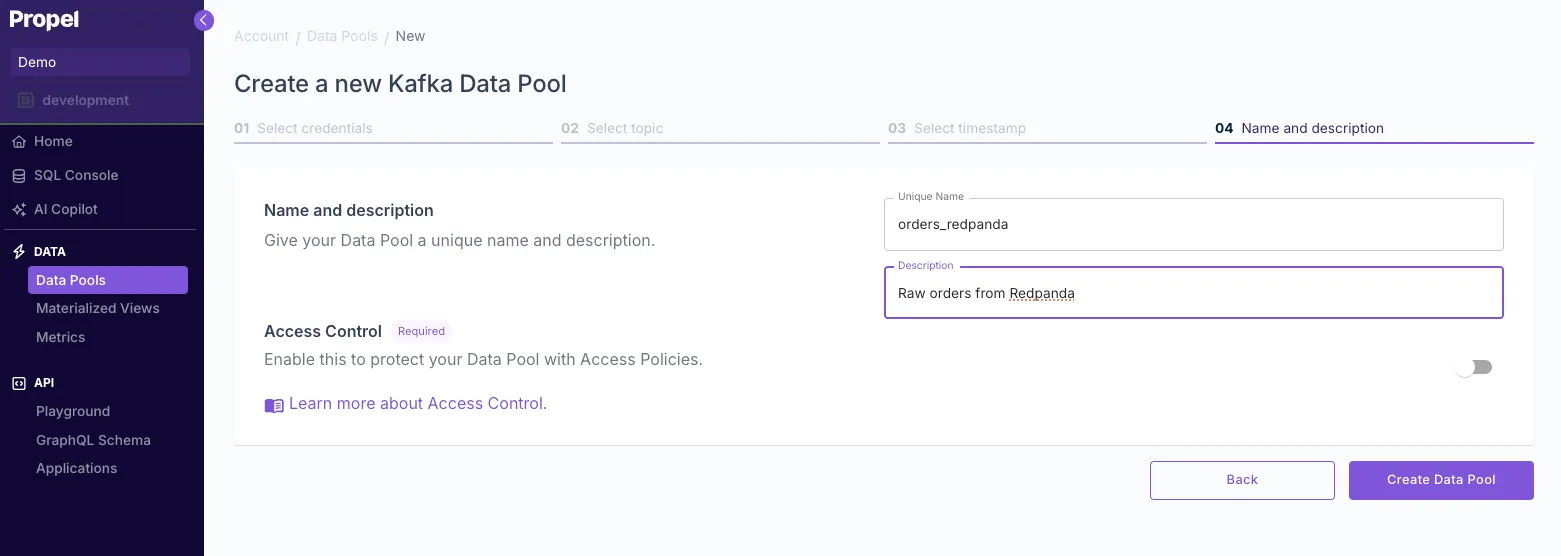
Continue with the default _timestamp field and then give your Data Pool a name and a description. For example:
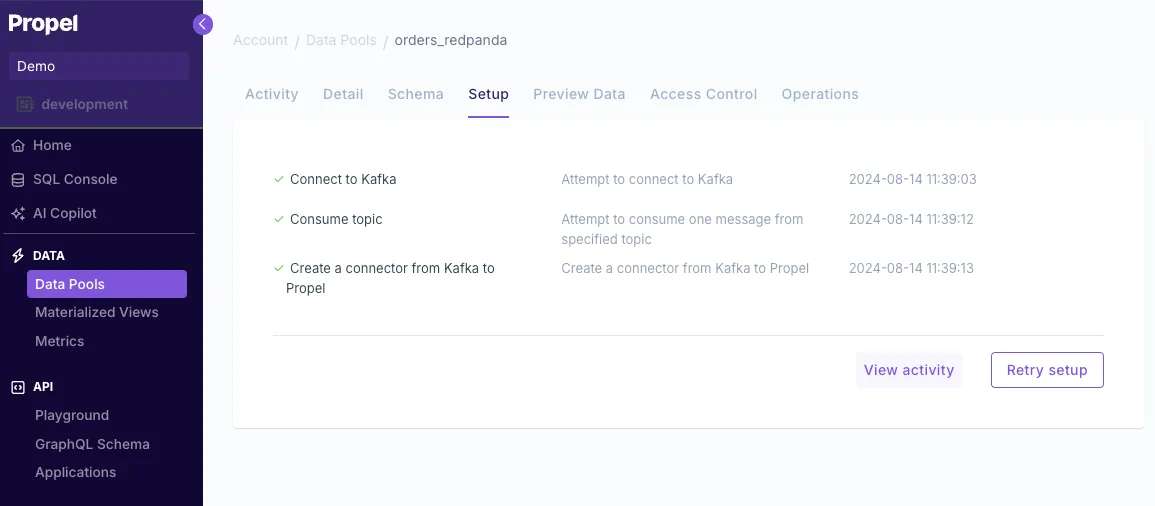
Lastly, you’ll see that the setup is correct and that data is being ingested.
To see the data, go to the Preview data tab.
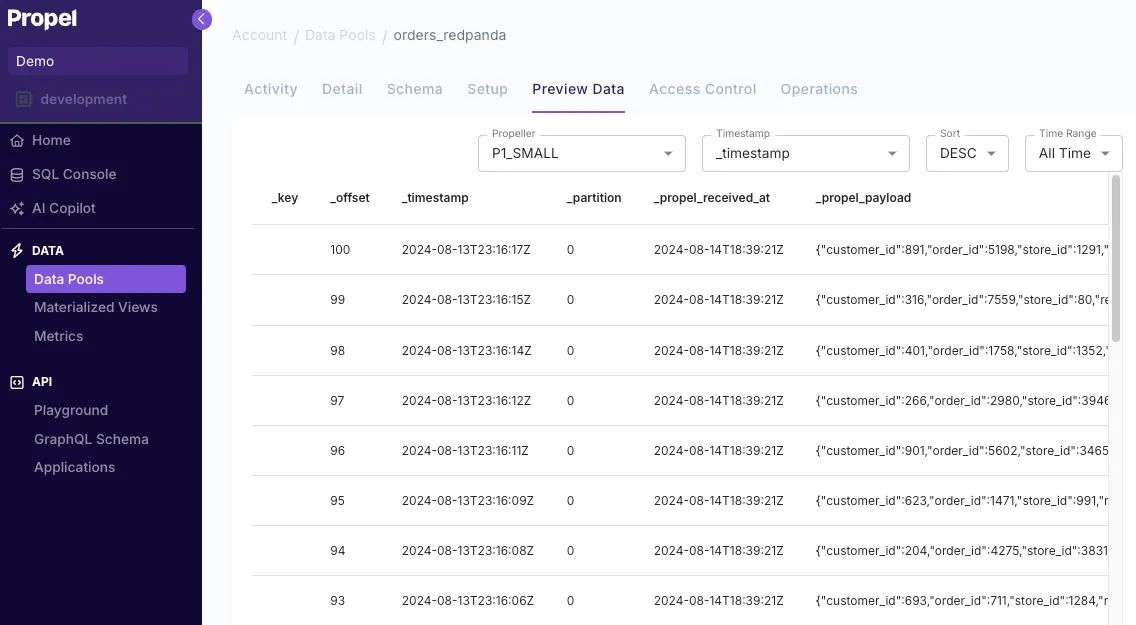
You’ll notice the message is stored as a single JSON column. While this makes the ingestion schema-less, it requires either querying the JSON or flattening it into a new table. We’ll take a look at both approaches.
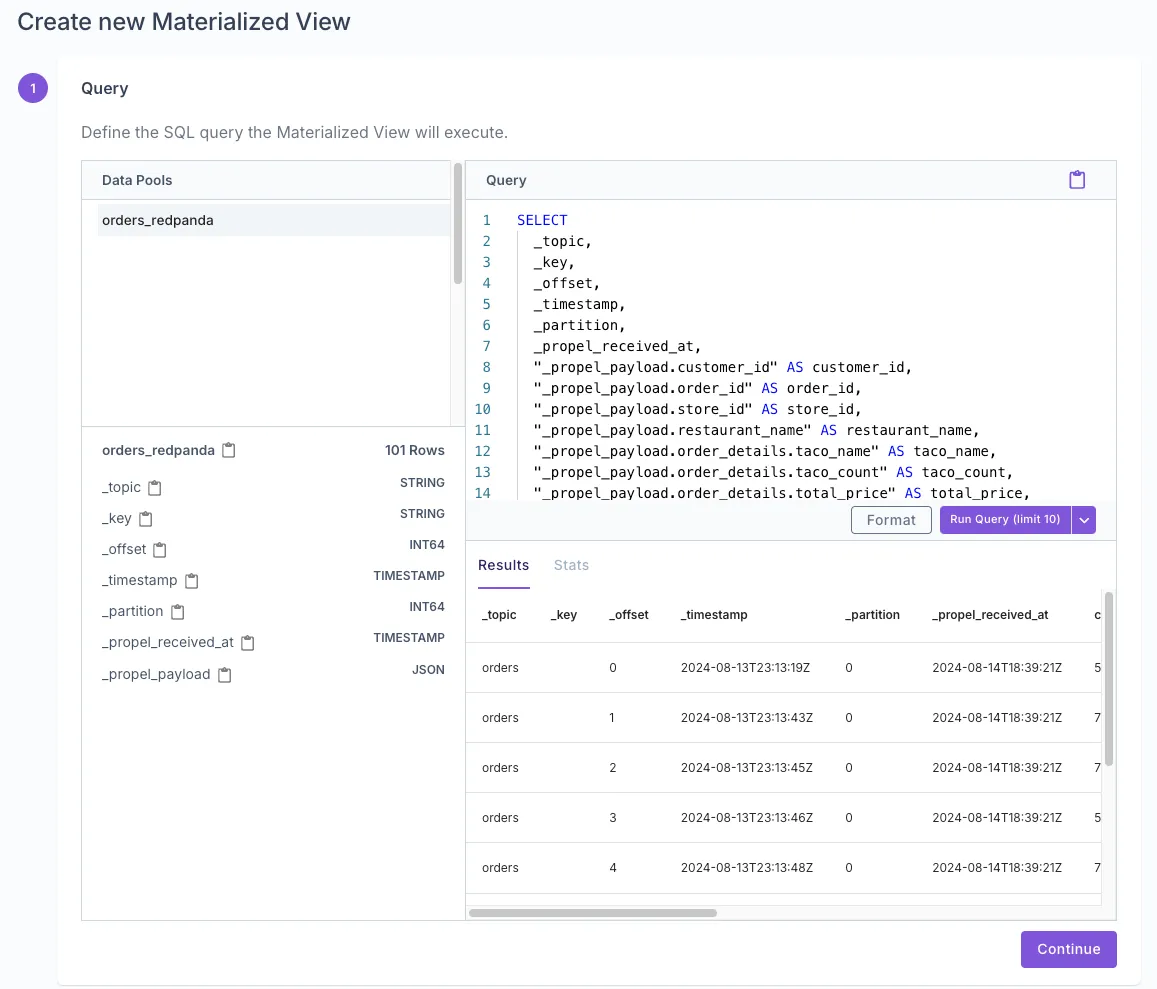
You can go to the SQL Console and enter the query below. This query flattens the different JSON keys into individual columns. This is the query:
SELECT
  _topic,
  _key,
  _offset,
  _timestamp,
  _partition,
  _propel_received_at,
  "_propel_payload.customer_id" AS customer_id,
  "_propel_payload.order_id" AS order_id,
  "_propel_payload.store_id" AS store_id,
  "_propel_payload.restaurant_name" AS restaurant_name,
  "_propel_payload.order_details.taco_name" AS taco_name,
  toInt32 ("_propel_payload.order_details.taco_count") AS taco_count,
  toFloat32 ("_propel_payload.order_details.total_price") AS total_price,
  parseDateTimeBestEffort ("_propel_payload.order_details.checkout_time") AS checkout_time,
  parseDateTimeBestEffort ("_propel_payload.created_at") AS created_at
FROM
orders_redpanda;We want to materialize this query into a table that updates in real time as new data arrives. This flattened table will serve as the data source for our dashboard's APIs.
Materialized Views are perfect for this task. To create a Materialized View, navigate to the Materialized Views section in the Propel Console and click Create Materialized View. Then, enter the query from the step above and click Run query to test.
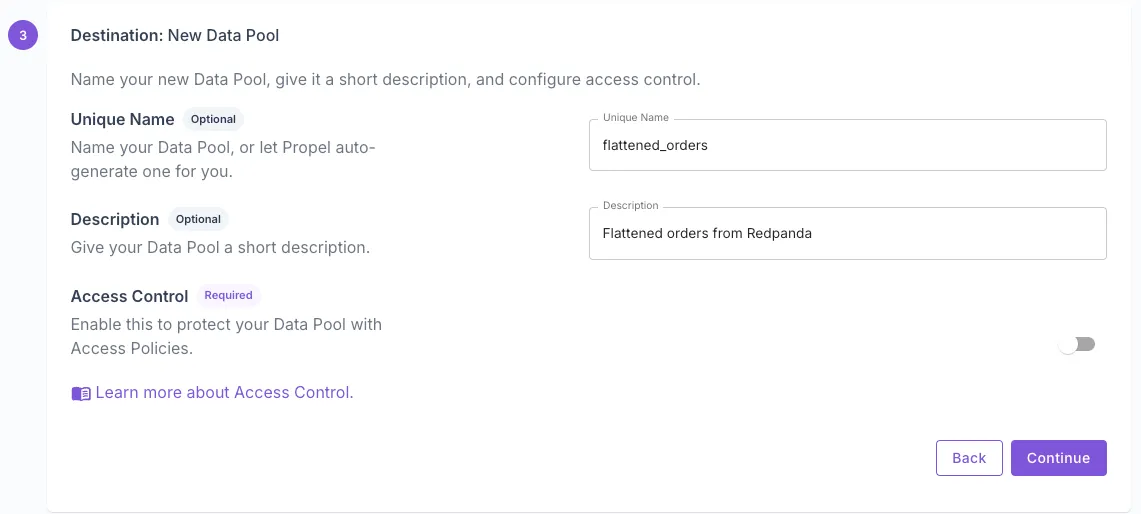
Then select New Data Pool and enter a name and description. Turn Access Control off (simpler for this example, but recommended to turn on in production). For example:
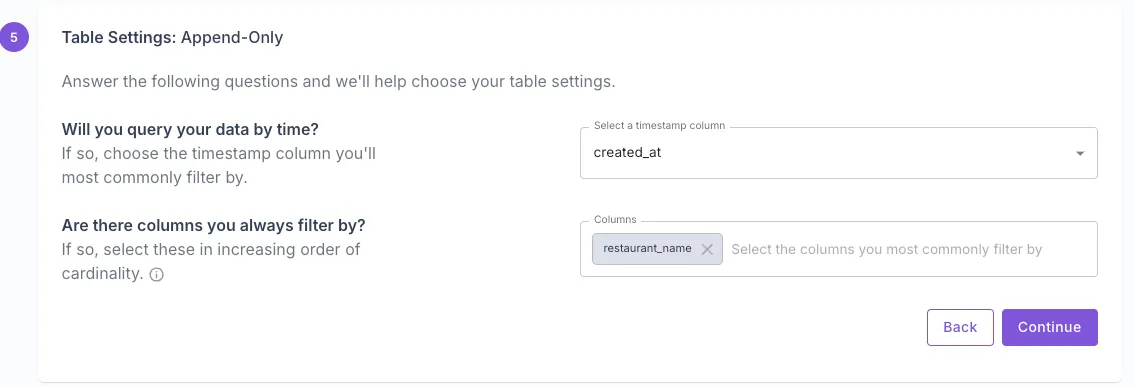
Then, select Append-only data as our data will be immutable order events. Here, we can answer the questions for Propel and suggest the best settings for our table. We’ll want to query our data by created_at, and a common filter would be restaurant_name.
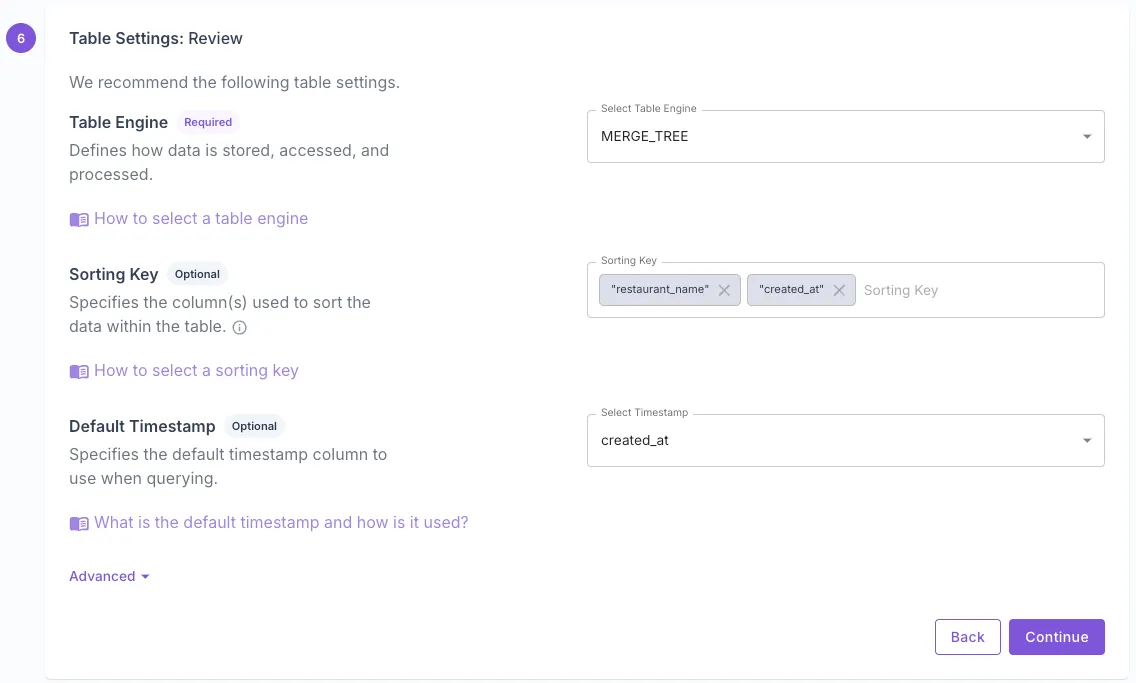
Propel then suggests the optimal ClickHouse table settings for our data and access patterns.
We’d want Propel to backfill our new Data Pool with the data we already have.
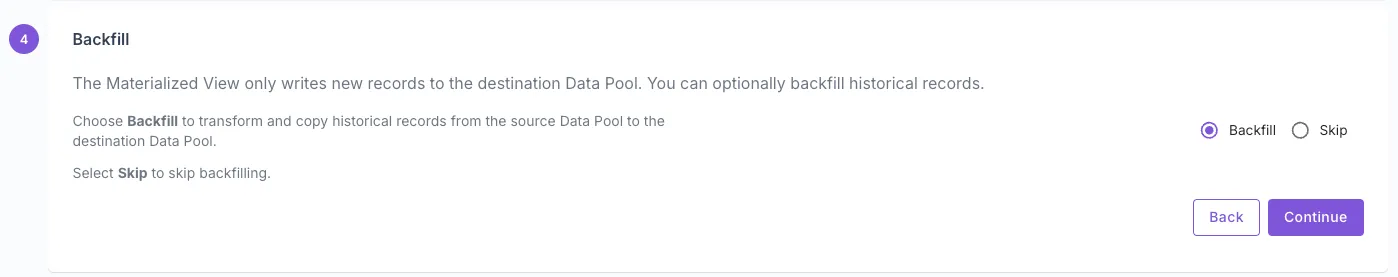
Lastly, we will give our Materialized View a name and description. For example:
And click Create Materialized View.

Once you create it, you’ll see a new “flattened_orders” Data Pool with the orders table with each JSON key in a column, which is ideal for powering the analytics of our dashboard.

Now that we are ingesting and transforming our order data in real-time, we can query via the API.
You can query the data via the API Playground in the Propel Console without writing any code. To get a time series of the order count over time:

Next, we want to make the API request from our terminal. On the top right, if you click on curl, you notice the request example that looks like this:
curl https://api.us-east-2.propeldata.com/graphql \
  -H "Authorization: Bearer <ACCESS TOKEN>" \
  -H 'Content-Type: application/json; charset=utf-8' \
  -d '{
  "query": "query TimeSeriesQuery($input: TimeSeriesInput!) {\n  timeSeries(input: $input) {\n    labels\n    values\n  }\n}",
  "variables": {
    "input": {
      "metric": {
        "count": {
          "dataPool": {
            "id": "DPO01J5BKQCECSBVV6RXCM67V11HK"
          }
        }
      },
      "timeZone": "UTC",
      "granularity": "DAY",
      "timeRange": {
        "relative": "LAST_N_DAYS",
        "n": 7,
        "timestamp": "created_at"
      },
      "filters": []
    }
  }
}'
To run this, we need our <ACCESS TOKEN>.
To get our access token, we need to create a Propel Application. Applications are OAuth 2.0 Clients that have credentials to mint access tokens.
Go to Applications in the left-hand side nav, then click Create Application.
DATA_POOL_QUERY scope.P1_X_SMALL. This is how fast Propel reads data in queries. The smallest one will do for our sample app.
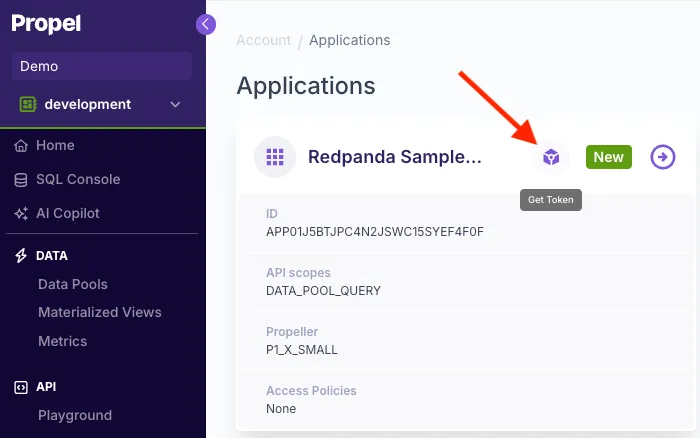
To get a sample access token, click Get token icon as indicated below. This access token has a 1-hour expiration.
Replace the access token in the curl request above, and you should see the response below:
{
  "data": {
    "timeSeries": {
      "labels": [
        "2024-08-09T00:00:00Z",
        "2024-08-10T00:00:00Z",
        "2024-08-11T00:00:00Z",
        "2024-08-12T00:00:00Z",
        "2024-08-13T00:00:00Z",
        "2024-08-14T00:00:00Z",
        "2024-08-15T00:00:00Z"
      ],
      "values": [
        "0",
        "0",
        "0",
        "0",
        "101",
        "0",
        "0"
      ]
    }
  }
}
Now that we’ve got our data flowing, being transformed in real-time, and exposed via an API, we can build our Next.js dashboard.
To start, clone the Propel Next.js starter app
git clone https://github.com/propeldata/propel-nextjs-starter-app-v2.git && cd propel-nextjs-starter-app-v2Next, rename the .env.sample file to .env.local and update it with the credentials of the Propel Application you just created. This will allow our app to authenticate with the API.
mv env.sample .env.localTo get your Application's client ID and secret, go to the Applications section of the Propel Console, click "Redpanda Sample App," and click to reveal the secret.
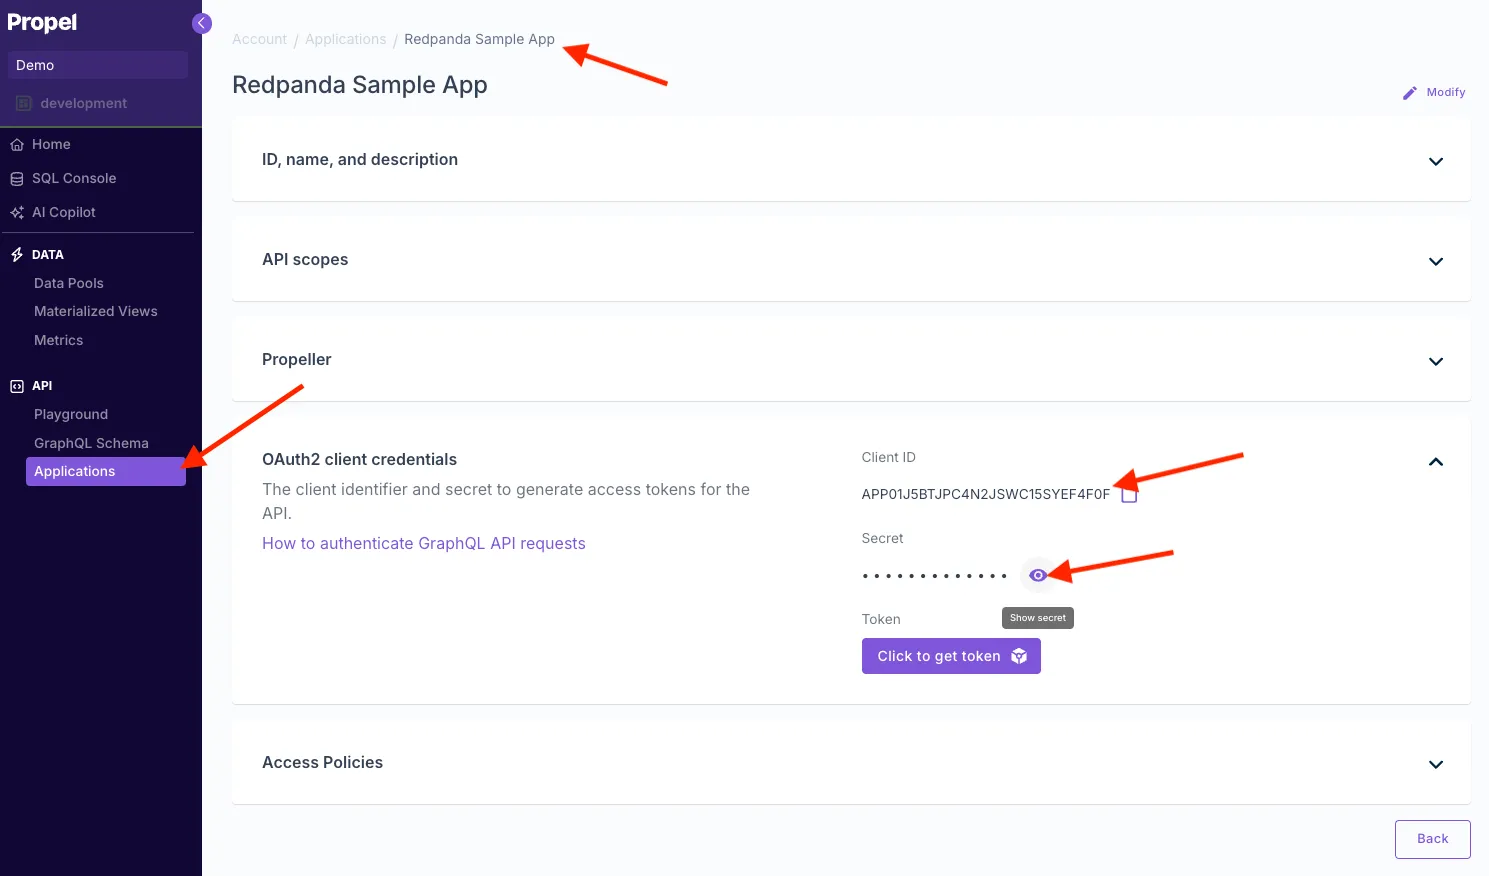
Open the .env.local file and update it with your Propel Application client ID and secret.
CLIENT_ID=your_client_id_here
CLIENT_SECRET=your_client_secret_here
TOKEN_HOST=auth.us-east-2.propeldata.com
TOKEN_PATH=/oauth2/token
Install dependencies
npm installRun the sample app
npm run devNow, if you visit http://localhost:3000, you'll see your app running. However, you'll notice that no data is displayed yet.
Open the page.tsx file and update the configuration constants with the following values to point to your table:
const dataPoolName = "flattened_orders"
const filter1 = "restaurant_name"
const filter2 = "taco_name"
const filter1Label = "Restaurant..."
const filter2Label = "Taco..."
const measure = "total_price"
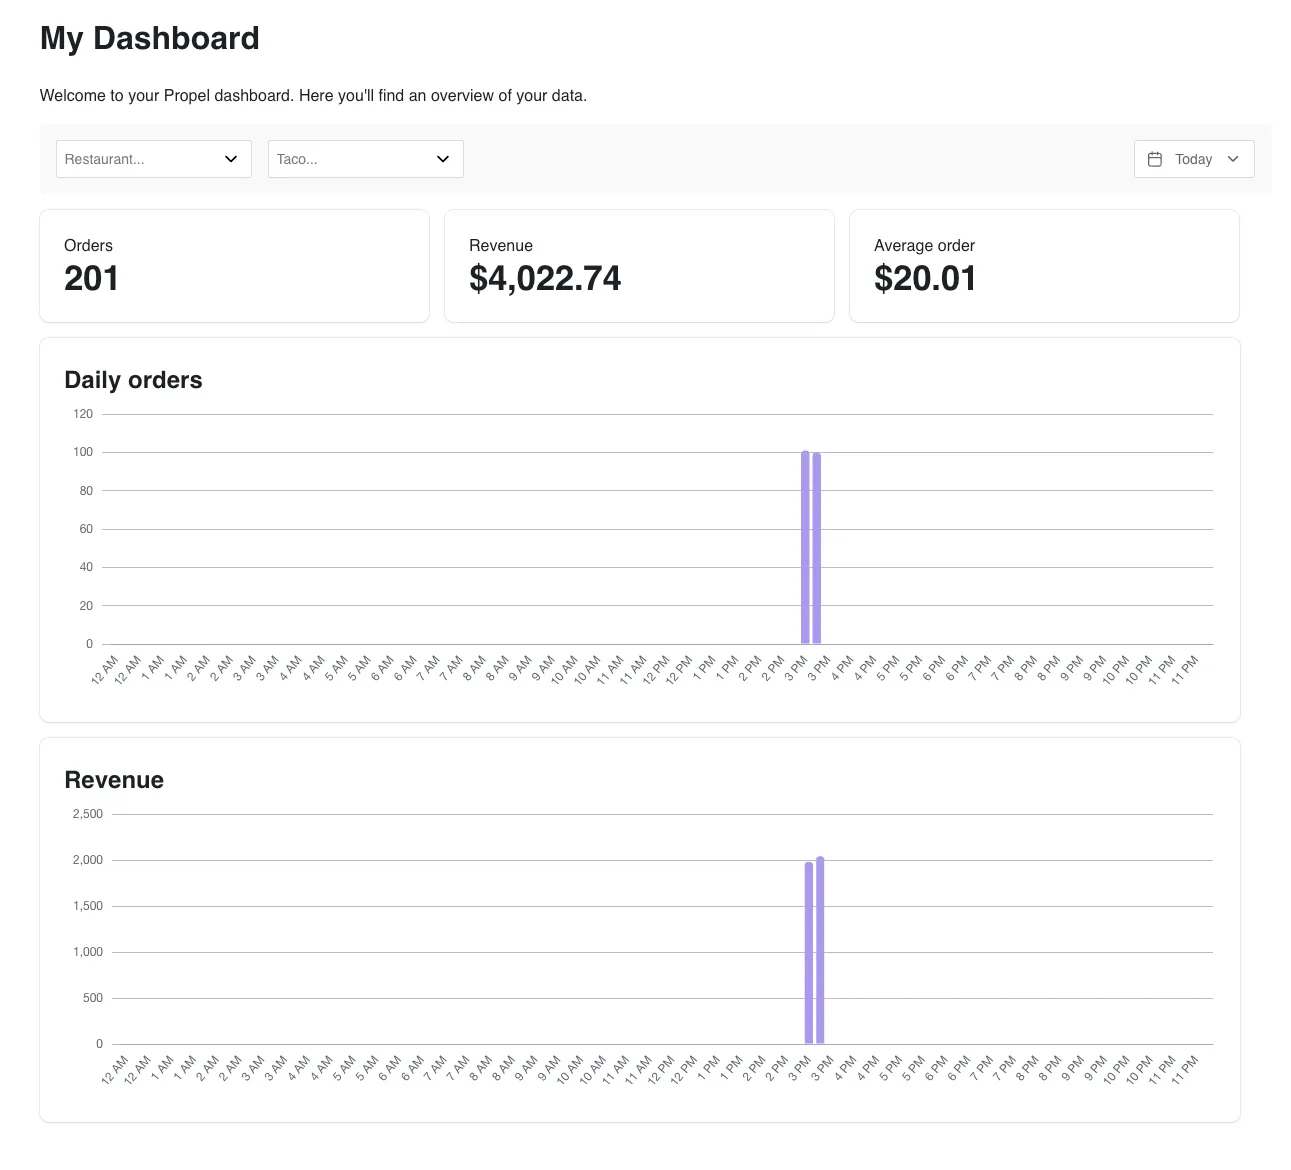
const counter1Label = "Orders"
const counter2Label = "Revenue"
const counter3Label = "Average order"
const chart1Label = "Daily orders"
const chart2Label = "Revenue"Now you should see data flowing into your app.
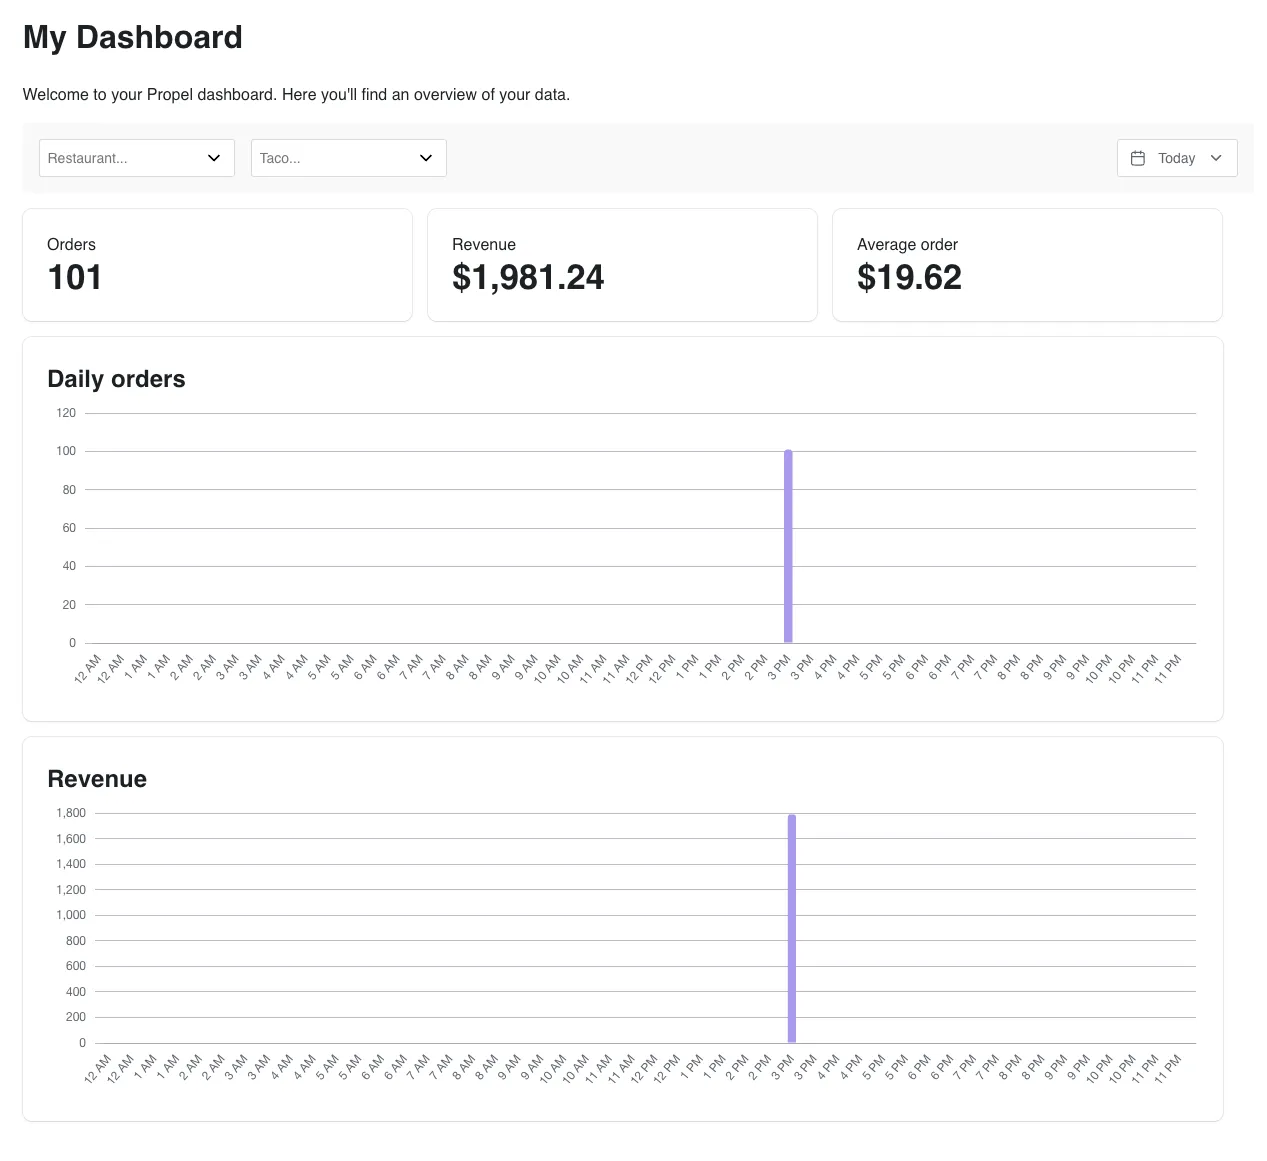
Lastly, we’ll generate a new batch of sample data and see it flow into our app. To do this, execute the script again:
./generate_messages.shAnd you’ll see it come into your dashboard:
Building real-time dashboards with Redpanda, Propel's Serverless ClickHouse, and Next.js offers a powerful solution for handling large-scale, real-time data processing and visualization. This combination provides several key benefits:
To deepen your understanding of these technologies, check out these resources:
Ready to start building your own real-time dashboard? Sign up for free accounts with Redpanda Serverless and Propel to experience the power of real-time data processing and analytics firsthand.
Subscribe to our VIP (very important panda) mailing list to pounce on the latest blogs, surprise announcements, and community events!
Opt out anytime.