Real-time call detail record (CDR) ingestion with Redpanda and Spark
Learn how to swiftly ingest and process insights on customer feedback in real time

Call detail records (CDRs) are rich sources of information in the telecommunications sector. They contain various data points related to a call, such as caller ID, call date, duration, receiver ID, and other pertinent details. Examining CDRs can yield valuable insights for performance assessment, cost efficiency, gathering customer feedback, analyzing the popularity of products/services, and enhancing security measures.
In this tutorial, you'll learn how to ingest real-time CDR data with Redpanda and Apache Spark. You'll also learn how to perform query operations (like aggregation and grouping) on real-time streaming data.
What are CDRs and why do they matter in telecom?
A CDR is a data entry generated by an exchange via telephone or similar equipment. It provides a comprehensive overview of a phone call or any other telecommunications activity, such as text messages, that goes through the respective facility or device.
A CDR includes call-related details such as the call time, status, phone numbers involved in the call (both sending and receiving), and more. It serves as the digital equivalent of the traditional paper toll tickets that operators once used to manually record the duration of long-distance calls within a standard telephone exchange.
Analyzing CDRs can provide significant insights in different use cases:
- Performance analysis: By analyzing the information in CDRs, telecom companies can identify patterns and trends, such as peak usage times, most dialed numbers, and call drop rates. This information can help them optimize their network performance and improve service quality.
- Cost optimization: CDRs can provide insights into usage patterns, which can help telecom companies optimize their pricing structures. For example, if the insights reveal that most calls occur during certain hours, a telecom company could introduce discounted rates during off-peak hours to encourage usage during those times.
- Customer feedback: Analysis of CDRs can reveal problems in service usage. For example, if a particular service or number has a high call drop rate, it might indicate a problem with that service or a network issue in the area where the number is located.
- Popularity analysis: Telecom companies can identify the most popular services or products by analyzing the usage data in CDRs. This can help guide their marketing efforts or develop new offerings based on customer preferences.
- Security: Unusual patterns in CDRs can indicate fraudulent activities. For example, a sudden increase in international calls from a particular number in a marked zone might indicate that the number is being used for suspicious activities. By monitoring CDRs for such patterns, telecom companies can detect and prevent fraudulent activities, thus enhancing security.
Ingesting real-time CDR data with Redpanda and Spark
In this tutorial, you'll learn how to ingest real-time CDR data with Redpanda and Spark, using the example of a telecom company that wants to analyze customer feedback to improve its services. The company collects CDRs that include a feedback_score for each call, which is a number from 1 to 5 that indicates the customer's satisfaction with the call. The higher the score, the more satisfied the customer was with the call.
The company wants to analyze these feedback scores to understand how customer satisfaction varies by day and by customer. Here are some sample CDR records in JSON format:
[
  {"customer_id": "C001", "call_date": "2024-02-01", "call_duration": 5, "feedback_score": 3},
  {"customer_id": "C002", "call_date": "2024-02-01", "call_duration": 10, "feedback_score": 4},
  {"customer_id": "C001", "call_date": "2024-02-02", "call_duration": 7, "feedback_score": 5},
  {"customer_id": "C003", "call_date": "2024-02-02", "call_duration": 9, "feedback_score": 3},
  {"customer_id": "C002", "call_date": "2024-02-03", "call_duration": 6, "feedback_score": 4},
  {"customer_id": "C001", "call_date": "2024-02-03", "call_duration": 8, "feedback_score": 5},
  {"customer_id": "C003", "call_date": "2024-02-03", "call_duration": 10, "feedback_score": 4},
  {"customer_id": "C001", "call_date": "2024-02-04", "call_duration": 6, "feedback_score": 3},
  {"customer_id": "C002", "call_date": "2024-02-04", "call_duration": 8, "feedback_score": 5},
  {"customer_id": "C003", "call_date": "2024-02-04", "call_duration": 7, "feedback_score": 4}
]
In this scenario, the telecom company can produce the CDRs in a streaming fashion to a Redpanda topic (cdr_topic in this example). It can then use Spark to consume these records from the Redpanda topic, perform a group by operation on customer_id and call_date, and calculate the average feedback_score for each group. This will provide a daily feedback score for each customer, which the company can analyze to understand how customer satisfaction varies by day and by customer.

Architecture diagram
Prerequisites
To complete the tutorial, you'll need the following:
- Docker Desktop (4.24 or the latest version)
- Python 3.11 or later
- An IDE of your choice
- A running Redpanda Console instance on Docker (23.3.5 or the latest version)
For this tutorial, use the YAML content provided in the "Single Broker" tab on this official page to set up Redpanda. Create a project directory, place your docker-compose.yaml file there, and start Redpanda.
1. Check your Redpanda container status
Once you start the Redpanda container in your environment, you should see the following result if you execute the command docker ps in a terminal:
CONTAINER ID   IMAGE                                                COMMAND                   CREATED          STATUS          PORTS
                                                          NAMES
afed5810f662   docker.redpanda.com/redpandadata/console:v2.4.3     "/bin/sh -c 'echo \"$…"   14 seconds ago   Up 10 seconds   0.0.0.0:8080->8080/tcp
                                                         redpanda-console
1d8c8dff5d60   docker.redpanda.com/redpandadata/redpanda:v23.3.5   "/entrypoint.sh redp…"    14 seconds ago   Up 11 seconds   8081-8082/tcp, 0.0.0.0:18081-18082->18081-18082/tcp, 9092/tcp, 0.0.0.0:19092->19092/tcp, 0.0.0.0:19644->9644/tcp   redpanda-0
By default, the provided docker-compose.yaml file manages two containers: one containing the Redpanda broker and another containing Redpanda Console and a UI application to interact with and view the Redpanda instance and broker.
2. Create a Redpanda topic
You'll need to create a topic named cdr_topic in your Redpanda cluster to receive the events from a demo producer application you'll create shortly.
To do that, open a browser and access the Redpanda Console application at http://localhost:8080/. You should see the interface pictured in the screenshot below:
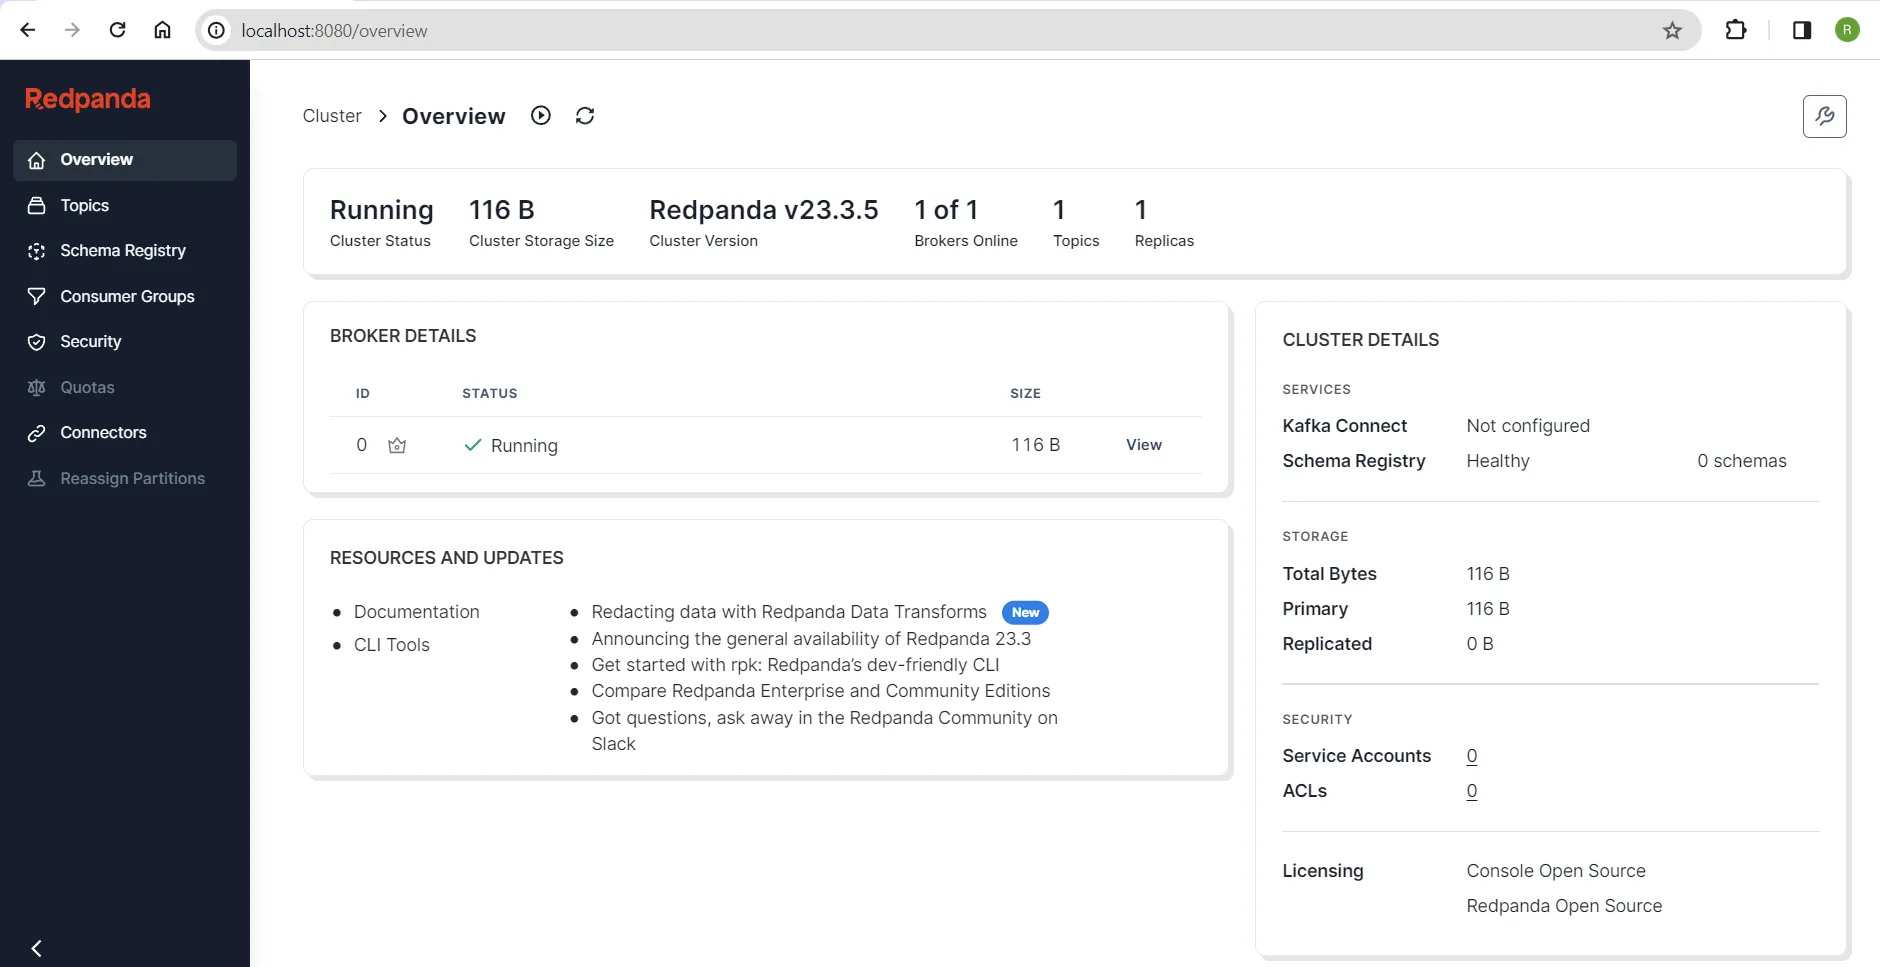
Redpanda Console home page
This interface provides an overview of the Redpanda cluster, including its health status. To create the topics in the cluster, click the Topics option in the side menu bar and click Create Topic:
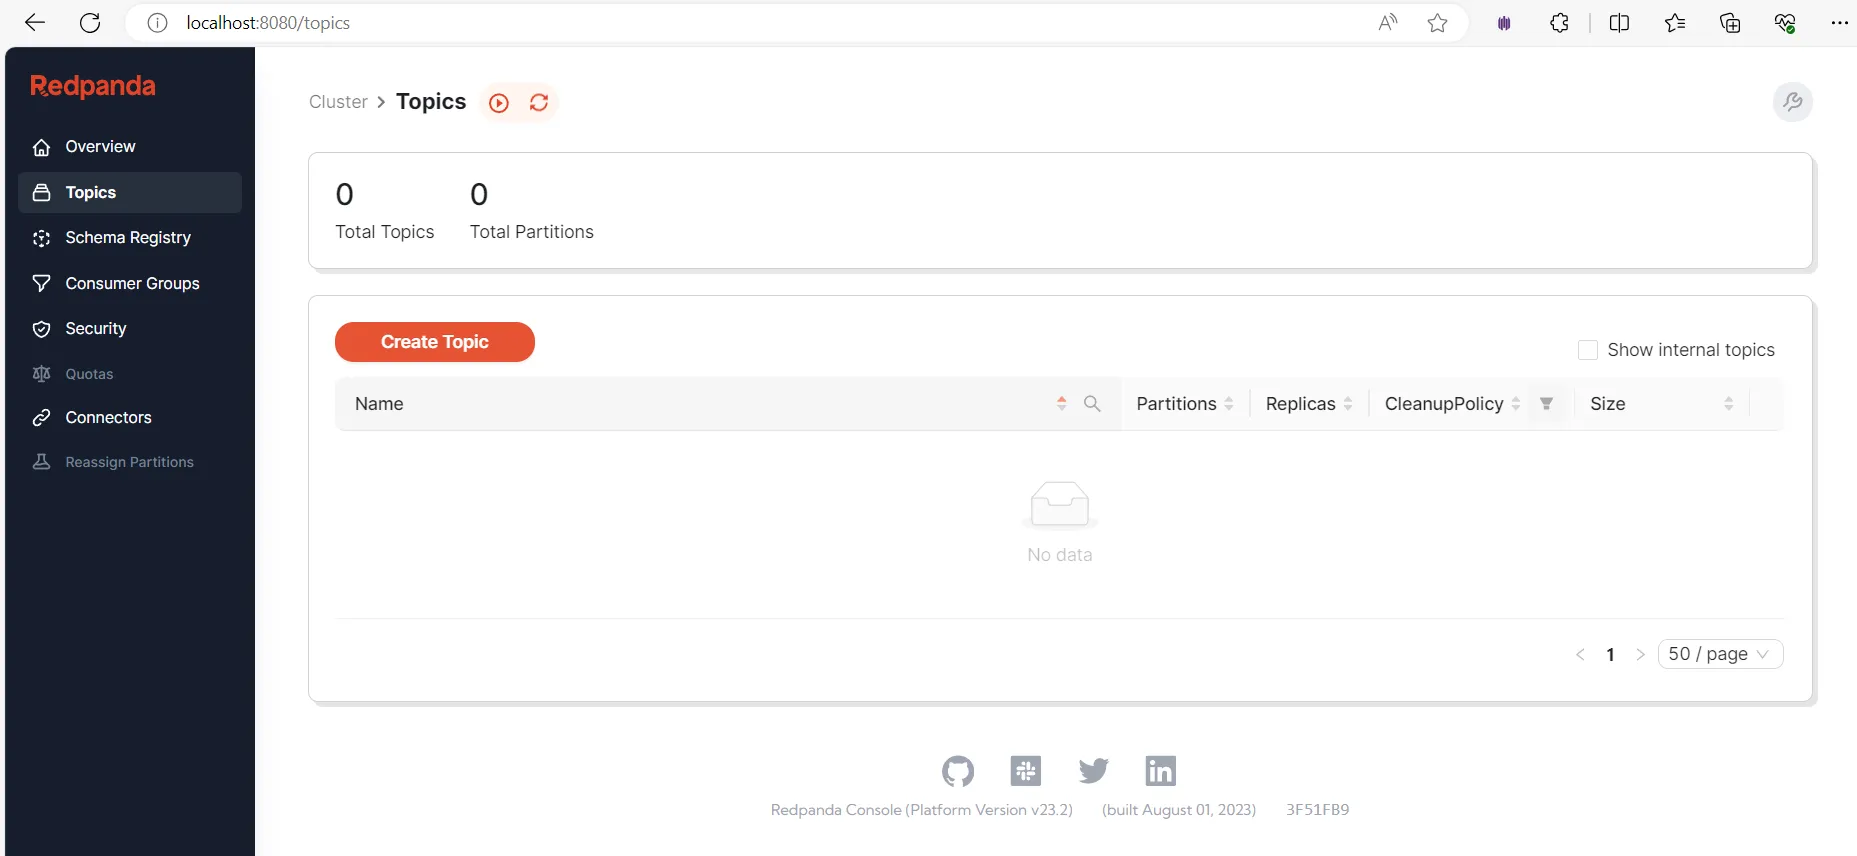
Creating a topic
Fill in the topic name on the resulting screen and click Create:

cdr_topic
3. Create the producer app
Now that your topic is ready, you can develop a Python app to generate the CDRs and publish the records to cdr_topic.
In your project directory, create a subdirectory called cdr_producer. Inside cdr_producer, create a requirements.txt file with the following contents:
kafka-python==2.0.2
The kafka-python library allows your Python application to interact with the Redpanda cluster. Prepare the virtual environment required for this Python application by running these commands in a new terminal:
python -m venv venv
venv\Scripts\activate
pip install -r requirements.txt
Keep this terminal open for later use.
In the same subdirectory, create a Python file called main.py with the following contents:
import json
import uuid

from kafka import KafkaProducer

# Define the Redpanda topic and Kafka producer
topic = "cdr_topic"
producer = KafkaProducer(bootstrap_servers='localhost:19092',
                         key_serializer=str.encode,
                         value_serializer=lambda v: json.dumps(v).encode('utf-8'))

# Input CDRs file - JSON format
source_file = "cdr_records.json"

# Open the file and read the CDRs
with open(source_file, 'r') as file:
    cdrs = json.load(file)
    for cdr in cdrs:
        # Generate message key (optional)
        message_key = str(uuid.uuid4())

        # Send the CDR to the Redpanda topic
        future = producer.send(topic, key=message_key, value=cdr)
        # Block until a single message is sent (or timeout in 15 seconds)
        result = future.get(timeout=15)

        print("Message sent, partition: ", result.partition, ", offset: ", result.offset)
This code acts as a simple producer application that reads CDR data from a JSON file and sends it to a Redpanda topic, potentially enabling further processing or analysis of the data stream.
Next, in the same subdirectory, create a JSON file called cdr_records.json to hold the sample CDRs. Paste the following into it:
[
  {"customer_id": "C001", "call_date": "2024-02-01", "call_duration": 5, "feedback_score": 3},
  {"customer_id": "C001", "call_date": "2024-02-01", "call_duration": 7, "feedback_score": 4},
  {"customer_id": "C002", "call_date": "2024-02-01", "call_duration": 10, "feedback_score": 5},
  {"customer_id": "C003", "call_date": "2024-02-01", "call_duration": 15, "feedback_score": 4},
  {"customer_id": "C004", "call_date": "2024-02-01", "call_duration": 17, "feedback_score": 4},
  {"customer_id": "C005", "call_date": "2024-02-01", "call_duration": 20, "feedback_score": 5},
  {"customer_id": "C006", "call_date": "2024-02-01", "call_duration": 25, "feedback_score": 5},
  {"customer_id": "C007", "call_date": "2024-02-01", "call_duration": 9, "feedback_score": 4},
  {"customer_id": "C008", "call_date": "2024-02-01", "call_duration": 4, "feedback_score": 5},
  {"customer_id": "C009", "call_date": "2024-02-01", "call_duration": 5, "feedback_score": 2},
  {"customer_id": "C010", "call_date": "2024-02-01", "call_duration": 8, "feedback_score": 3}
]
Your producer application is now ready to publish the CDRs.
4. Set up the Spark cluster
You'll now set up the Spark cluster by opening the docker-compose.yaml file you created earlier. Edit the YAML file to add the following code snippet at the bottom of the file, then save the file:
spark-master:
    image: bitnami/spark:3.4.2
    environment:
      - SPARK_MODE=master
    ports:
      - '8081:8080'
    networks:
      - redpanda_network
  spark-worker:
    image: bitnami/spark:3.4.2
    environment:
      - SPARK_MODE=worker
      - SPARK_MASTER_URL=spark://spark-master:7077
    volumes:
      - .\pyspark-app\:/pyspark-app/
    depends_on:
      - spark-master
    networks:
      - redpanda_network
This Docker Compose snippet defines a multicontainer setup for a Spark cluster, consisting of the following:
- The
spark-mastercontainer runs the Spark Master, which manages worker allocation and job coordination. It exposes port 8081 for the Spark UI. - The
spark-workercontainer runs a Spark Worker, which performs computations assigned by the Master. It connects to the Master atspark://spark-master:7077and mounts the local.\pyspark-appdirectory for persistent storage.
Both containers share redpanda_network and run the same Spark image, ensuring compatibility. This setup lets you easily deploy and manage a Spark cluster on Docker for your PySpark applications.
Start the Spark cluster by executing the following command in the same terminal as the docker-compose.yaml file:
docker compose up -d
Once the containers are up, you can open a browser and visit http://localhost:8081/ to access the Spark Master UI:

Spark Master UI
5. Create the PySpark app
You'll now create a PySpark application to consume CDRs from the cdr_topic and process them. This involves computing the total call_duration for each customer_id and call_date.
Inside your main project directory, create a subdirectory named pyspark-app. Inside pyspark-app, create a requirements.txt file with the following contents:
pyspark==3.5.0
The pyspark library allows the PySpark application to interact with the Spark and Redpanda clusters. Prepare the virtual environment required for this Python app by running the following commands in a command line terminal:
python -m venv venv
venv\Scripts\activate
pip install -r requirements.txt
Keep this terminal open for later use.
In the same subdirectory, create a Python file called cdr_processor.py and paste the following code into it:
# Import the required classes and functions
from pyspark.sql import SparkSession
from pyspark.sql.functions import from_json, col, to_json, struct, sum
from pyspark.sql.types import StructType, StructField, StringType, IntegerType

# Define the schema of the CDR records
cdr_schema = StructType([
    StructField("customer_id", StringType()),
    StructField("call_date", StringType()),
    StructField("call_duration", IntegerType()),
    StructField("feedback_score", IntegerType())
])

# Create a SparkSession
spark = SparkSession.builder.appName("CDRProcessor").getOrCreate()

# Stream the CDR records from the input topic (cdr_topic)
# The records are read from the Kafka broker running at redpanda-0:9092
# The read stream is stored in cdr_df
cdr_df = spark \
    .readStream \
    .format("kafka") \
    .option("kafka.bootstrap.servers", "redpanda-0:9092") \
    .option("subscribe", "cdr_topic") \
    .option("startingOffsets", "latest") \
    .option("group.id", "cdr_processor_group") \
    .load()

# Parse the value column of the read stream as JSON and store it in cdr_df
cdr_df = cdr_df.select(from_json(col("value").cast("string"), cdr_schema).alias("cdr"))

# Perform the aggregation
result_df = cdr_df \
    .groupBy("cdr.customer_id", "cdr.call_date") \
    .agg(sum("cdr.call_duration").alias("total_call_duration"))

# Write the result to the output topic (cdr_output_topic)
query = result_df \
    .select(to_json(struct(col("*"))).alias("value")) \
    .writeStream \
    .outputMode("update") \
    .format("kafka") \
    .option("kafka.bootstrap.servers", "redpanda-0:9092") \
    .option("topic", "cdr_output_topic") \
    .option("checkpointLocation", "/pyspark-app/checkpoint-dir") \
    .start()

# Wait for the query to terminate
query.awaitTermination()
Save this Python file.
This script reads the CDR records in real-time from the cdr_topic and then proceeds to aggregate call durations based on customer and call date. The result is written to cdr_output_topic.
6. Submit the Spark Job
Now that the CDR processing app is ready on the Spark end, open a terminal and execute the following command to initiate a terminal session with the worker node:
docker exec -it redpanda-quickstart-spark-worker-1 bash
Submit the Spark job by executing the following command to launch your cdr_processor.py script on a Spark cluster and ensure it has the necessary Kafka libraries for streaming data access and processing:
spark-submit --packages org.apache.spark:spark-sql-kafka-0-10_2.12:3.4.2 /pyspark-app/cdr_processor.py
7. Run the producer app
Now that your consumer app is up and running, you can focus on the producer app. Switch back to the terminal where you activated the producer app's virtual environment earlier. Execute the following command to start publishing the CDRs to cdr_topic:
python main.py
You should see an output similar to the one shown below:
Message sent, partition:  0 , offset:  0
Message sent, partition:  0 , offset:  1
Message sent, partition:  0 , offset:  2
Message sent, partition:  0 , offset:  3
Message sent, partition:  0 , offset:  4
Message sent, partition:  0 , offset:  5
Message sent, partition:  0 , offset:  6
Message sent, partition:  0 , offset:  7
Message sent, partition:  0 , offset:  8
Message sent, partition:  0 , offset:  9
Message sent, partition:  0 , offset:  10
This output indicates that the CDRs in JSON format were published to the Redpanda topic.
8. View the results
Go back to Redpanda Console in your browser and navigate to the Topics screen. You should now see two topics:
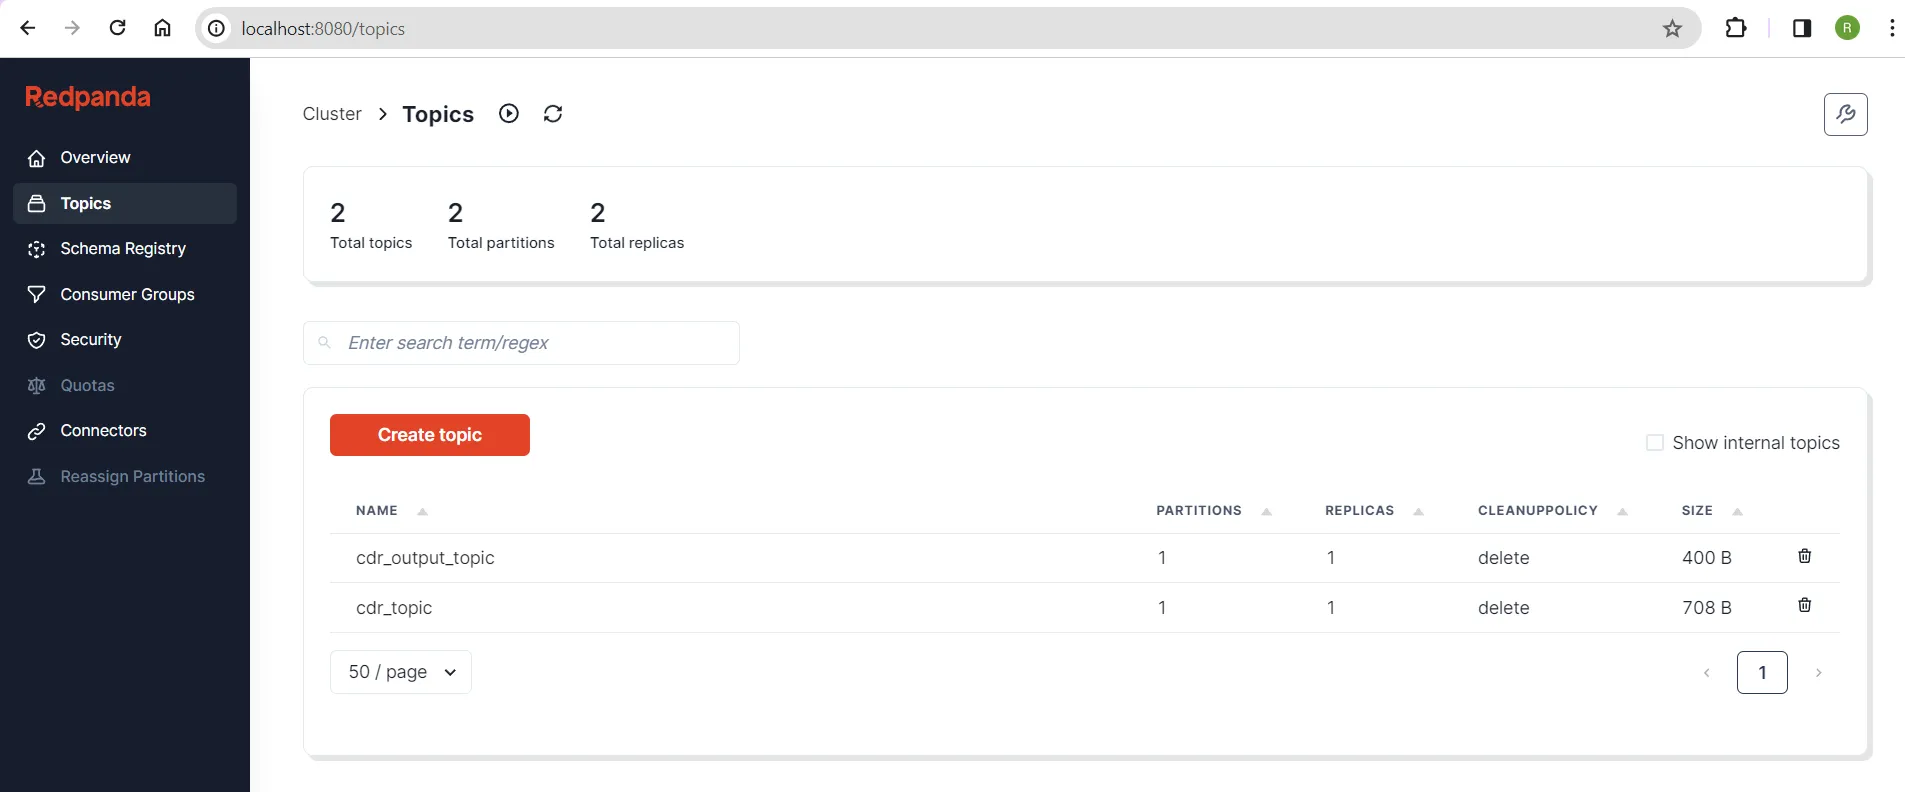
Two topics
The second topic, cdr_output_topic, was automatically created by the Spark app when it fetched CDRs from the source topic and wrote the processed records to the output topic. You can view the contents of each topic to understand how they were processed.
Click the source topic (cdr_topic) to view the messages that were published from the producer app:
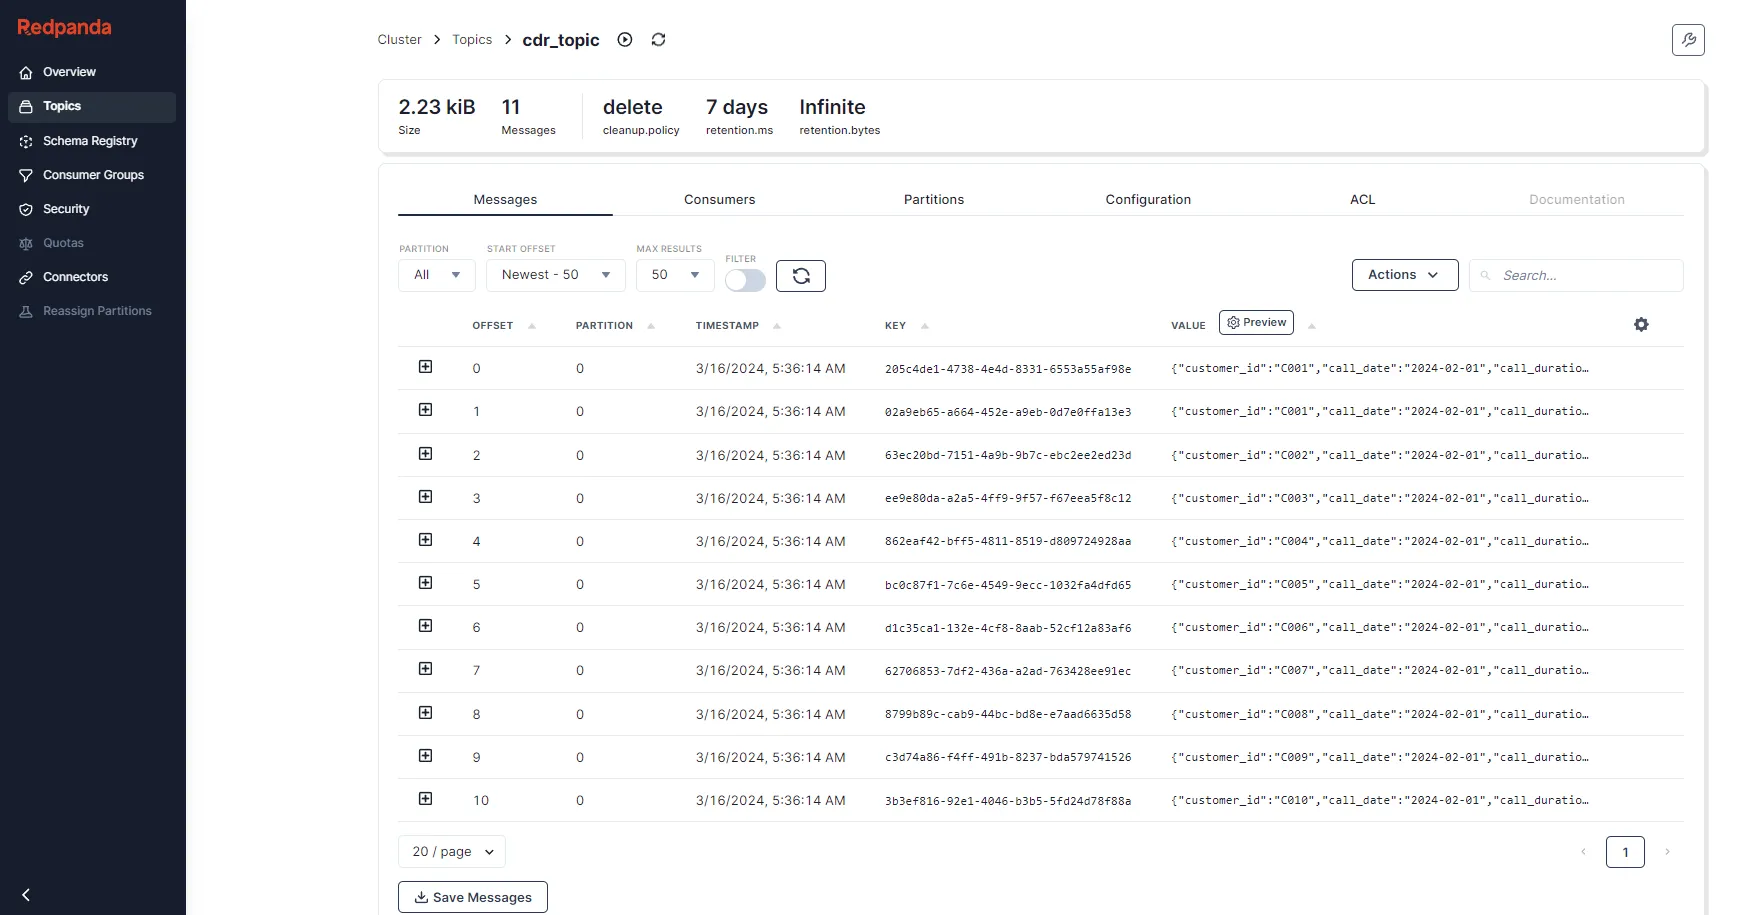
Messages in cdr_topic
You had eleven records in the project's cdr_records.json file, so the screen displays eleven CDRs.
Return to the Topics page and select the output topic (cdr_output_topic). You'll be taken to the following screen, where you can see the messages that were published from the PySpark application:
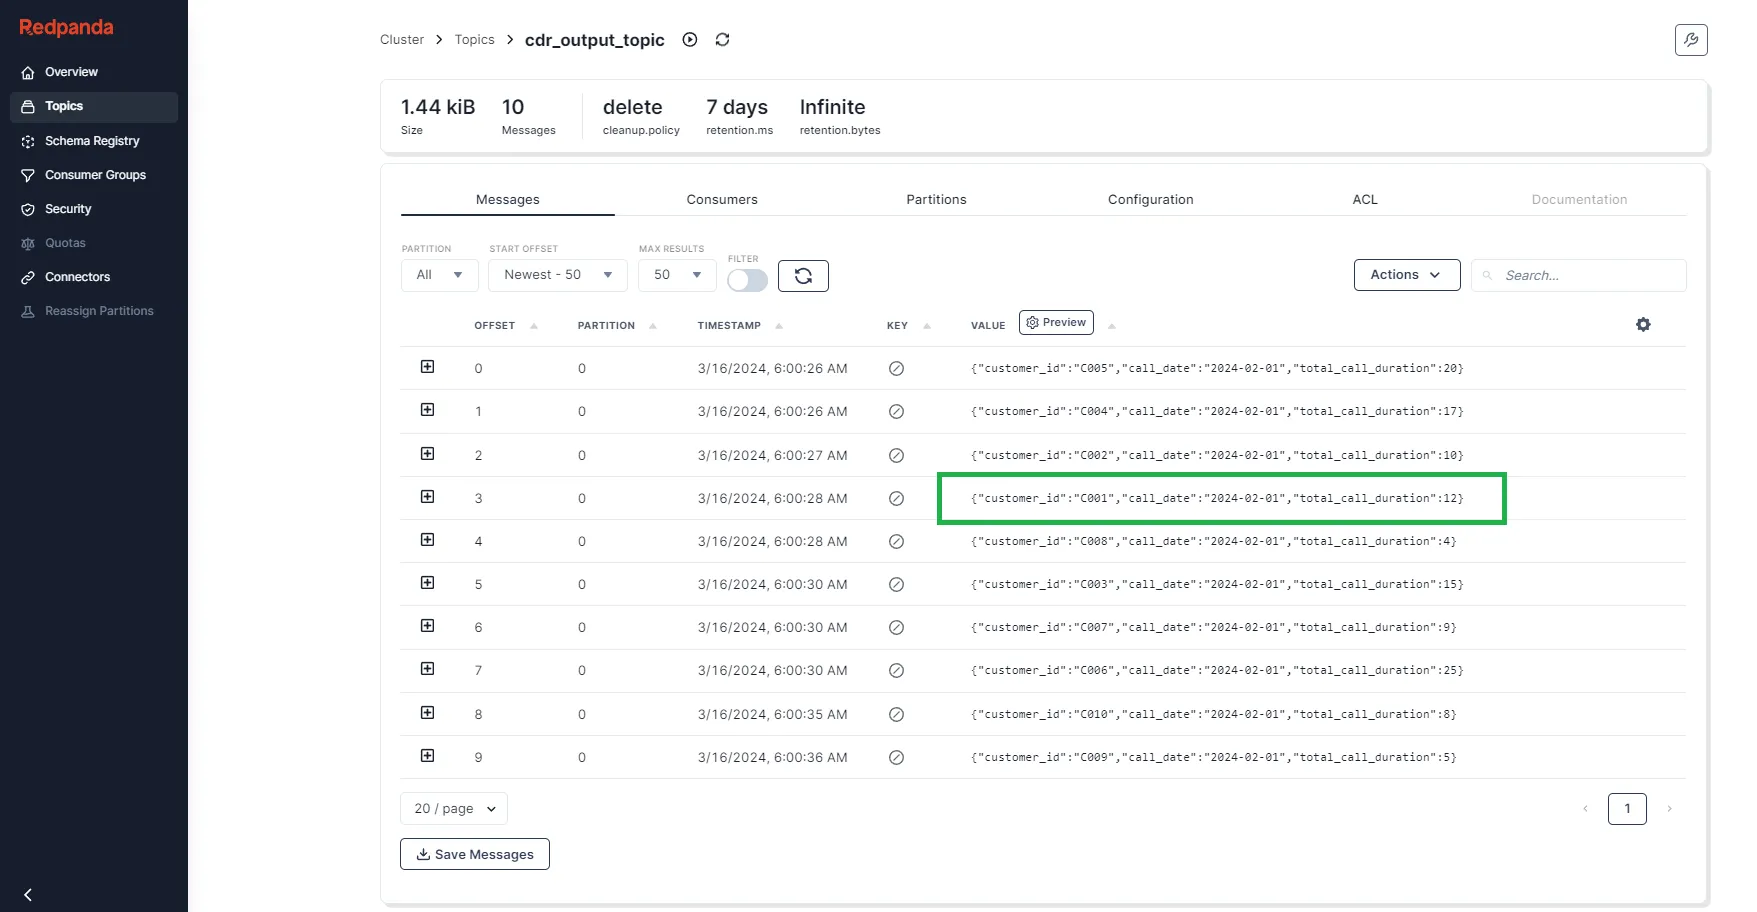
Messages in cdr_output_topic
You can see that the total call duration is 12 for the customer ID C001, which is the sum of the duration of two different calls by the same customer on the same day. You can also try replacing the contents of the cdr_records.json file with the following set of new sample data:
[
  {"customer_id": "C001", "call_date": "2024-02-02", "call_duration": 7, "feedback_score": 5},
  {"customer_id": "C001", "call_date": "2024-02-02", "call_duration": 8, "feedback_score": 4},
  {"customer_id": "C003", "call_date": "2024-02-02", "call_duration": 9, "feedback_score": 3}
]
After you save the file, start the producer app again to see the new results from Redpanda Console based on the steps detailed earlier.
Note: You don't need to resubmit the Spark job again. It should already be running and listening to the incoming messages to cdr_topic, unless you terminated the session.
Conclusion
In this tutorial, you learned how to ingest real-time CDR data with Redpanda and process it with Spark to derive insights on customer feedback in the telecom domain. You successfully developed a Kafka producer app and published the CDRs to a topic. You then used a Spark real-time streaming application to consume those messages and process the aggregated results to another topic.
You can find the complete code for this tutorial in this GitHub repository. To explore Redpanda, check the documentation and browse the Redpanda blog for more tutorials. If you have questions or want to chat with the team, join the Redpanda Community on Slack.
Related articles
VIEW ALL POSTSLet's keep in touch
Subscribe and never miss another blog post, announcement, or community event. We hate spam and will never sell your contact information.


