
Full CDC semantics land in the Iceberg output for Redpanda Connect
Your lakehouse mirrors the database, instantly.

Learn how to process sensor data in real time, detect repeating patterns, and trigger alarms to prevent equipment damage and defects


This post explores Flink’s capabilities for a real-time IoT monitoring system, where we demonstrate how to process sensor data in real time, detect repeating patterns, and trigger alarms to prevent equipment damage and defects.
But first, let’s start with the basics.
Flink is a distributed stream processing framework that excels at handling real-time data processing tasks. It offers a unique combination of features, including event-time processing, exactly-once processing guarantees, and efficient state management. It has a wide range of applications in different domains, making it a versatile choice for businesses and developers.
This tutorial demonstrates Flink's role in real-time IoT monitoring. Flink can ingest, process, and analyze sensor data in real time, helping you identify patterns that could lead to equipment damage or defects. It can also help you ensure the health and reliability of manufacturing equipment.
Let’s get started!
Before you begin building a real-time equipment monitoring system with Redpanda and Flink, you should have the following:
Before diving into the technical details, let's establish a scenario for the real-time IoT monitoring use case.
Business goal: You're tasked with ensuring the reliability and health of critical equipment in a manufacturing plant. Any unexpected failures can lead to costly downtimes, production delays, and, in some cases, safety concerns.
Objective: Implement a real-time equipment monitoring system that continuously collects data from IoT sensors attached to the equipment. The system must detect patterns that could indicate potential issues, such as overheating, unusual vibrations, or abnormal readings. Early detection will allow proactive maintenance and prevent equipment damage or defects.
Key metrics: The success of this system will be measured by the reduction in unplanned downtime, maintenance cost savings, and the number of equipment-related incidents.
Technical details: The following diagram illustrates the components involved in this real-time equipment monitoring system:
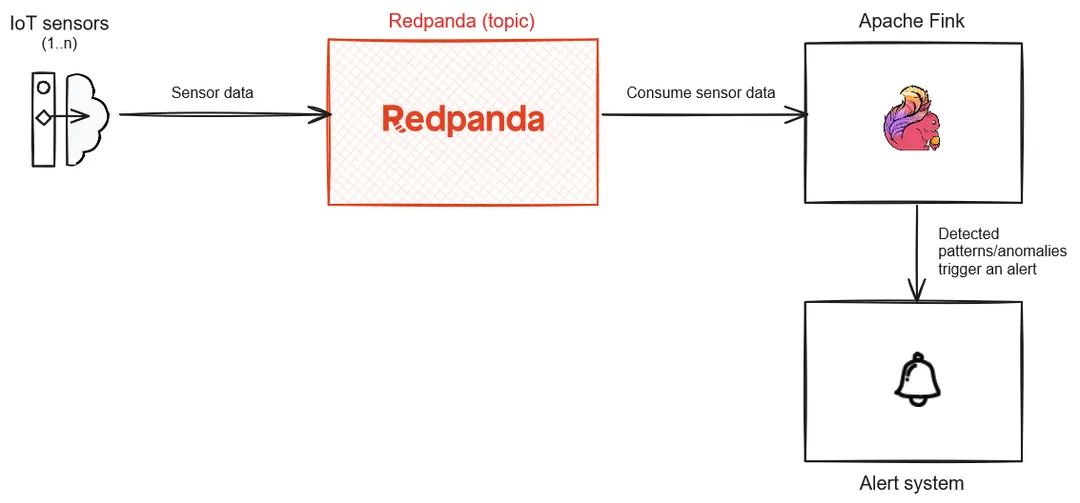
Rough architecture diagram
Let's get onto the actual implementation. You first need to create a project directory on your machine.
Inside your project directory, create a directory named flink-kafka-connector and copy the Flink Kafka connector JAR that you downloaded into this directory. You'll need this to allow Flink streaming queries to interact with Redpanda.
Create a docker-compose.yaml file in your project directory and paste the corresponding code from the official Redpanda quick start guide. In addition to that, append the below code to define the Flink-related container services:
flink-job-manager:
    container_name: flink-job-manager
    image: apache/flink:1.17.1
    ports:
      - "8081:8081"
    environment:
      - REDPANDA_HOST=redpanda-0:19092
      - |
        FLINK_PROPERTIES=
        jobmanager.rpc.address: flink-job-manager
    #  The volume mount suggests that this Flink Job Manager is using a Kafka connector,
    # which allows Flink to interact with a Redpanda cluster.
    volumes:
      - ./flink-kafka-connector/flink-sql-connector-kafka-1.17.1.jar:/opt/flink/lib/flink-sql-connector-kafka-1.17.1.jar
    command: jobmanager
    networks:
      - redpanda_network

  flink-taskmanager:
    container_name: flink-taskmanager
    image: apache/flink:1.17.1
    depends_on:
      - flink-job-manager
    environment:
      - |
        FLINK_PROPERTIES=
        jobmanager.rpc.address: flink-job-manager
        taskmanager.numberOfTaskSlots: 2
    volumes:
      - ./flink-kafka-connector/flink-sql-connector-kafka-1.17.1.jar:/opt/flink/lib/flink-sql-connector-kafka-1.17.1.jar
    command: taskmanager
    networks:
      - redpanda_network
Next, open a terminal and run this command to start the Redpanda and Flink container services:
docker compose up -d
Once the containers are up and running, you should get the following result when you execute docker ps in the same terminal:
CONTAINER ID   IMAGE                                                COMMAND                   CREATED          STATUS          PORTS
                                                          NAMES
b2a7f63e6d35   docker.redpanda.com/redpandadata/console:v2.3.1      "/bin/sh -c 'echo \"$…"   21 seconds ago   Up 16 seconds   0.0.0.0:8080->8080/tcp
                                                          redpanda-console
801c998a2895   apache/flink:1.17.1                                  "/docker-entrypoint.…"    21 seconds ago   Up 17 seconds   6123/tcp, 8081/tcp
                                                          flink-taskmanager
bb23cc15261b   docker.redpanda.com/redpandadata/redpanda:v23.2.14   "/entrypoint.sh redp…"    21 seconds ago   Up 17 seconds   8081-8082/tcp, 0.0.0.0:18081-18082->18081-18082/tcp, 9092
/tcp, 0.0.0.0:19092->19092/tcp, 0.0.0.0:19644->9644/tcp   redpanda-0
e526af3b857b   apache/flink:1.17.1                                  "/docker-entrypoint.…"    21 seconds ago   Up 19 seconds   6123/tcp, 0.0.0.0:8081->8081/tcp
flink-job-managerYou need to create two topics in your Redpanda cluster:
temperature_sensor to receive the events from the IoT simulator application that you'll create shortlynotification_events to register the notification/alerting events as a result of the Flink streaming app transformation processTo start, open a browser and visit http://localhost:8080/ to access the Redpanda Console application:
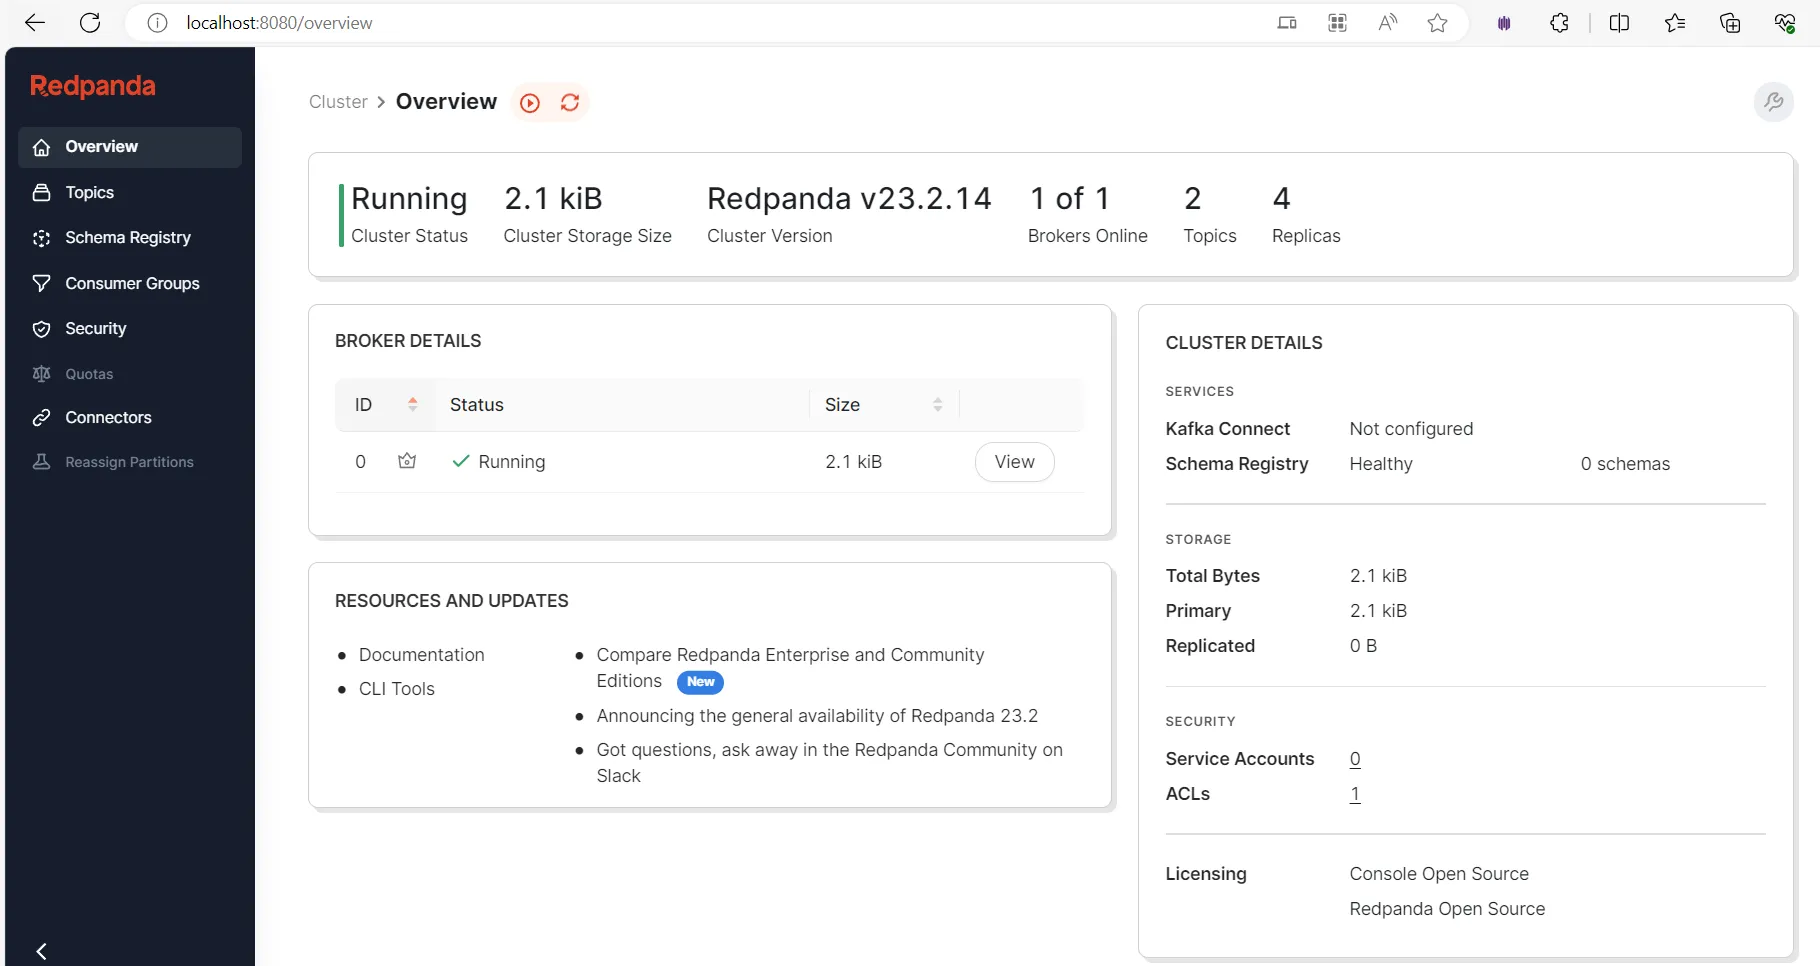
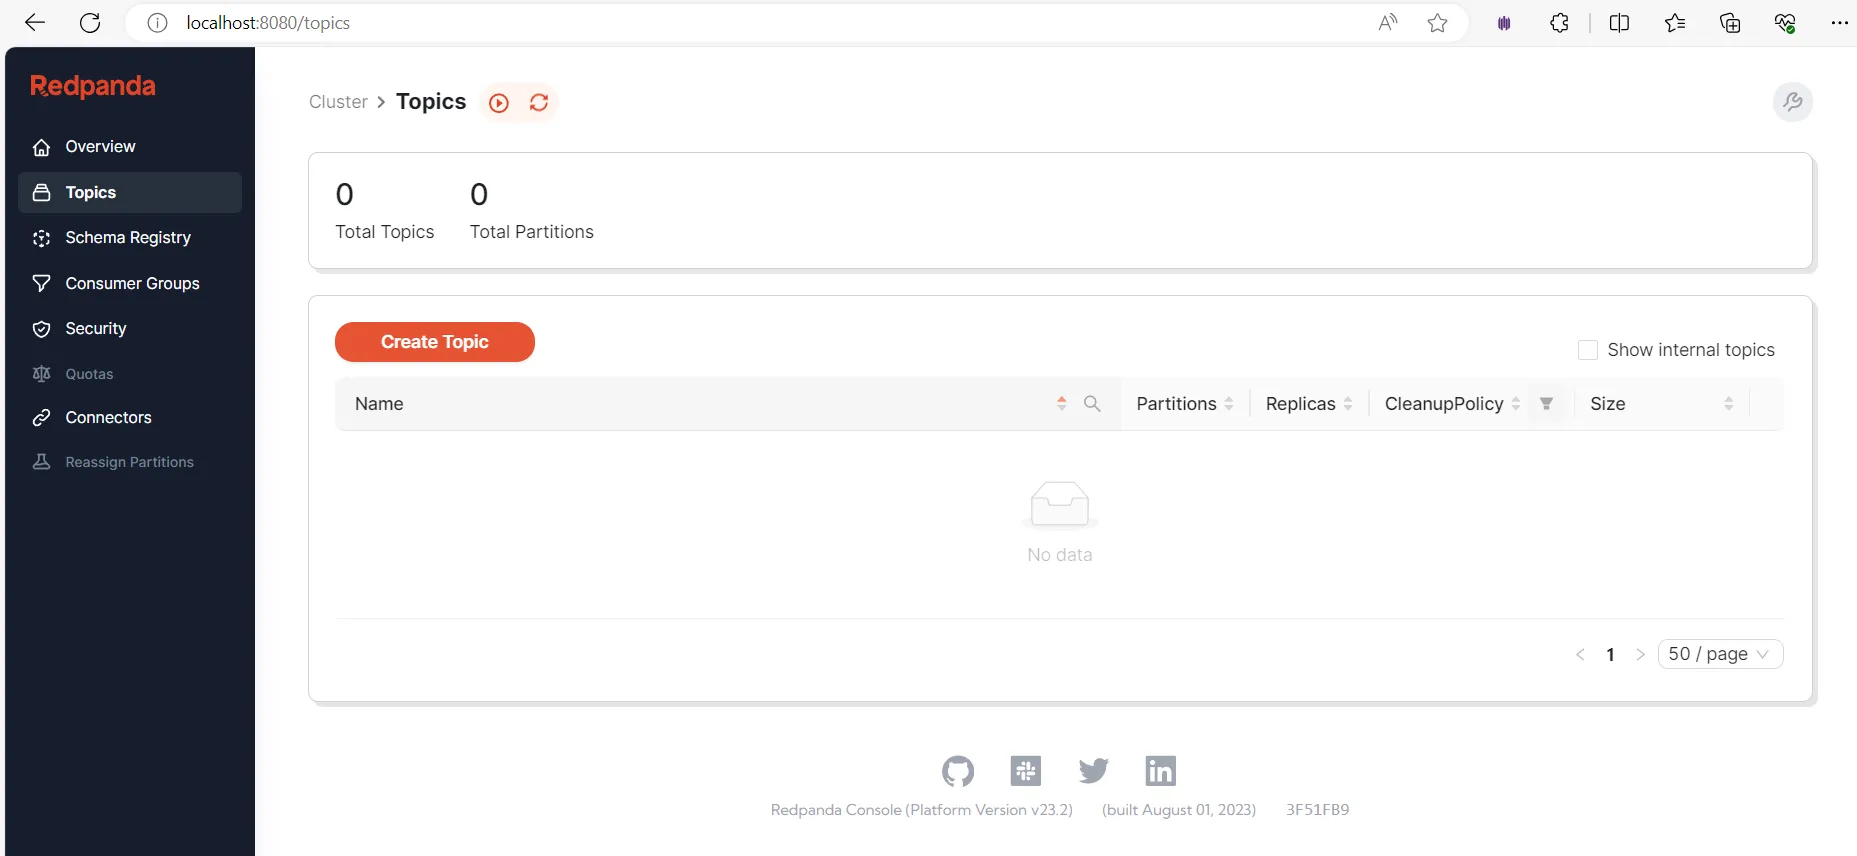
Here, you can see an overview and the health status of the Redpanda cluster. To create topics in the cluster, click Topics in the side menu and click Create Topic:
Fill in the topic name in the on-screen prompt and click Create:
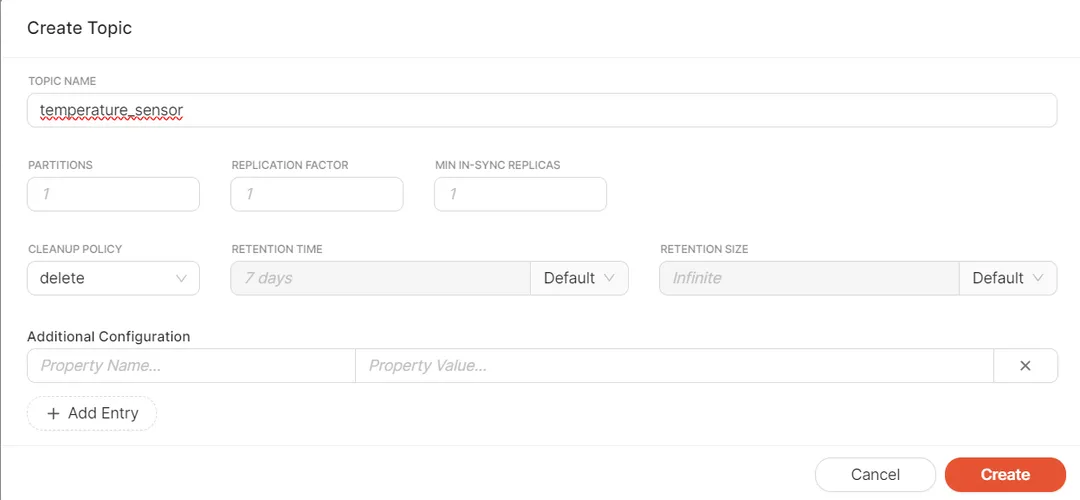
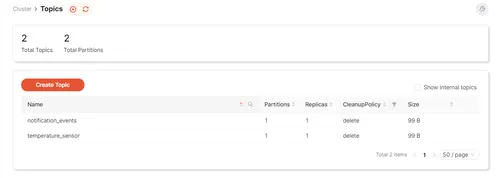
Repeat the same steps to create the notification_events topic. Once done, both topics should be listed under the "Create Topic" button:
Alternatively, you can do all the above steps programmatically with rpk, a CLI tool for interacting with a Redpanda cluster.
Now that your topics are ready, let's go ahead and develop a Python app that simulates the IoT sensor data. This simulator app will send the temperature data to your first Redpanda topic, temperature_sensor.
Create a requirements.txt file in the project directory and paste in the code below:
kafka-python==2.0.2
The kafka-python library allows the Python app to interact with the Redpanda cluster. You can prepare the virtual environment required for this Python app by running the following commands in a command line terminal (keep this terminal open for later use):
python -m venv venv
venv\Scripts\activate
pip install -r requirements.txt
Next, create a Python package named iot-sensor-simulator using your preferred IDE. Inside that package, create a Python module called produce-sensor-data.py and paste in the code below:
from kafka import KafkaProducer
import random
import time
import json

# Define the Redpanda topic and Kafka producer
topic = "temperature_sensor"
producer = KafkaProducer(bootstrap_servers='localhost:19092', value_serializer=lambda v: json.dumps(v).encode('utf-8'))

# Simulate temperature readings
while True:
    # Generate a random temperature reading between 0°C and 100°C
    temperature = random.uniform(0, 100)

    # Create a JSON payload with a timestamp and temperature value
    data = {
        "timestamp": int(time.time()),
        "temperature": temperature
    }

    # Send the data to the Redpanda topic
    producer.send(topic, value=data)
    print(f"Sent data: {data}")

    # Simulate data every 5 seconds (adjust the interval as needed)
time.sleep(5)Your Python simulator app is now ready to produce temperature sensor data to the topic, so you can move on to create a consumer using Flink.
On Flink, you'll run a streaming query to consume data from the temperature_sensor topic and detect patterns. In this case, any temperature reading above 60°C will trigger a notification event to your second topic, notification_events.
Open a new terminal and connect to the Flink job manager's container terminal by executing the following command:
docker exec -it flink-job-manager bash
You'll use the Flink SQL Client, a CLI-based application, to submit table programs or Flink jobs to a Flink cluster. This allows you to interact with Flink's Table and SQL APIs. This tool will stream the data from the temperature_sensor topic and then produce the alarming events to the notification_events topic. Connect to the sql-client.sh CLI interface by executing the following command in the Flink job manager's container terminal:
sql-client.sh embeddedYou should see an output similar to the one below:
Welcome! Enter 'HELP;' to list all available commands. 'QUIT;' to exit.

Command history file path: /root/.flink-sql-history

Flink SQL>
Next, execute the following command in the above Flink SQL prompt to define a table named temperature_sensor to facilitate the data streaming from the temperature_sensor topic:
CREATE TABLE temperature_sensor (
   temperature DOUBLE,
   ts TIMESTAMP(3),
   WATERMARK FOR ts AS ts - INTERVAL '5' SECOND
) WITH (
   'connector' = 'kafka',
   'topic' = 'temperature_sensor',
   'properties.bootstrap.servers' = 'redpanda-0:9092',
   'properties.group.id' = 'cg_1',
   'scan.startup.mode' = 'earliest-offset',
   'format' = 'json'
);
The table has the following specifications:
temperature is a field of type DOUBLE to store temperature readings.ts is a field of type TIMESTAMP(3) to store timestamps associated with each temperature reading.WATERMARK FOR ts AS ts - INTERVAL '5' SECOND line defines a watermark strategy for event-time processing. It's saying that any event with a timestamp (ts) that is more than five seconds older than the maximum timestamp seen so far is considered late.WITH clause specifies properties for connecting to a Kafka topic:'connector' = 'kafka' specifies that the connector type is Kafka.'topic' = 'temperature_sensor' specifies the Kafka topic name.'properties.bootstrap.servers' = 'redpanda-0:9092' specifies the address of the Kafka bootstrap server.'properties.group.id' = 'cg_1' specifies the consumer group ID for the Kafka consumer.'scan.startup.mode' = 'earliest-offset' specifies that the Kafka consumer should start consuming from the earliest offset in the topic.In summary, this command defines a table in Flink that reads data from a Kafka topic named temperature_sensor. The data is expected to be in JSON format and contains temperature readings along with their associated timestamps.
Similarly, define another table named notification_events to produce the alerting or notification events to your target topic:
CREATE TABLE notification_events (
   temperature DOUBLE
) WITH (
   'connector' = 'kafka',
   'topic' = 'notification_events',
   'properties.bootstrap.servers' = 'redpanda-0:9092',
   'format' = 'json'
);
Execute the INSERT statement below to extract the temperature readings that exceed the value of 60 and produce the identified pattern of records as events into the target notification_events topic:
INSERT INTO notification_events
SELECT temperature
FROM temperature_sensor
WHERE temperature > 60;
You should see an output similar to the one below:
[INFO] Submitting SQL update statement to the cluster...
[INFO] SQL update statement has been successfully submitted to the cluster:
Job ID: 3549cc0def14134606bcebcff8fbb7ecThe Flink job has now been submitted to consume the incoming temperature sensor readings, and you can run the Python app that you created earlier for generating temperature readings. Switch to the command line terminal, which should be still active in your Python app's virtual environment, and execute this command:
python iot-sensor-simulator\produce-sensor-data.pyYou should start seeing an output generating temperature readings one by one:
Sent data: {'timestamp': 1699105319, 'temperature': 53.57524954563365}
Sent data: {'timestamp': 1699105324, 'temperature': 12.633941164102346}
Sent data: {'timestamp': 1699105329, 'temperature': 25.797944478255065}
Sent data: {'timestamp': 1699105334, 'temperature': 59.97157998845765}
Sent data: {'timestamp': 1699105339, 'temperature': 97.28872564878496}
Sent data: {'timestamp': 1699105344, 'temperature': 64.17179488745744}
Sent data: {'timestamp': 1699105349, 'temperature': 75.17949439574046}
Sent data: {'timestamp': 1699105354, 'temperature': 52.73660062477933}
Sent data: {'timestamp': 1699105359, 'temperature': 94.62147761948029}
…
The simulator app will send these events to the temperature_sensor topic.
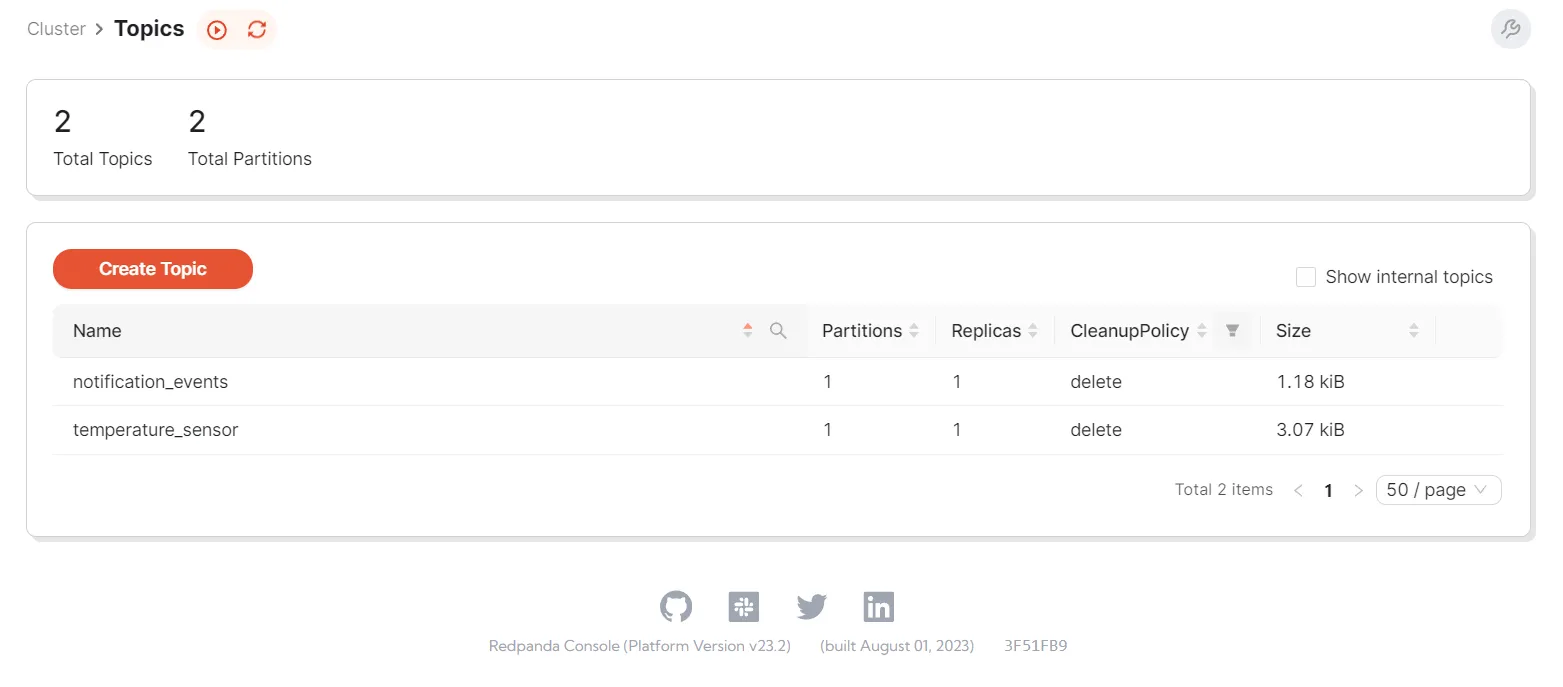
Let's view the events created in both topics. Access the Redpanda Console UI screen again. If you go to the same Topics screen as before, you should see that both of the topics are populated with data. Notice that the sizes of these topics have increased because the simulator app is pushing new messages into them:
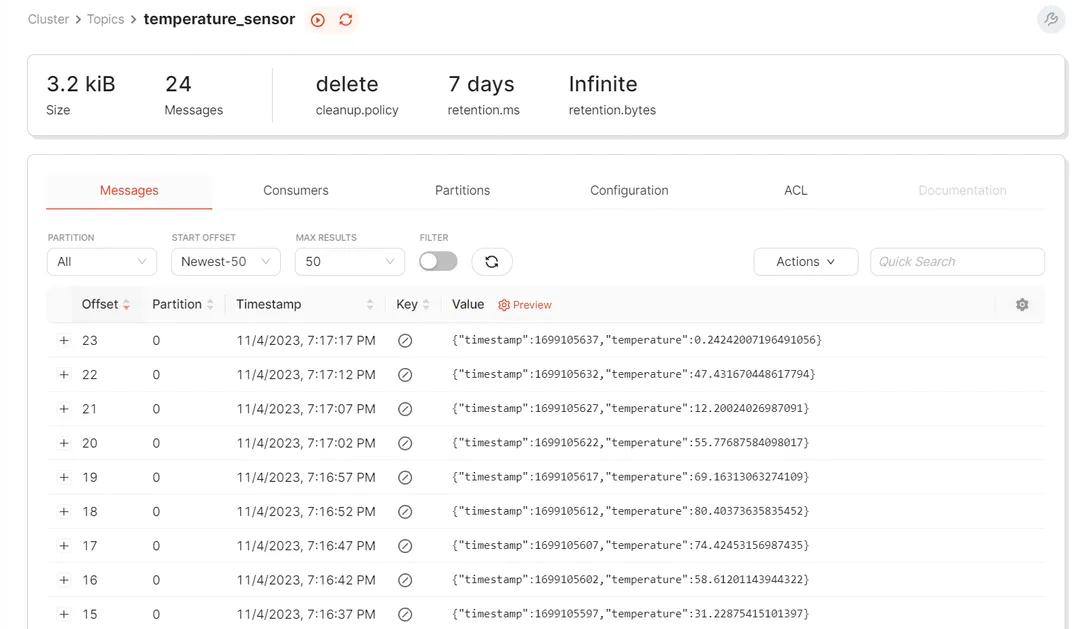
Click the temperature_sensor topic to view the data. Notice that this topic contains all the temperature readings that the simulator app has produced:
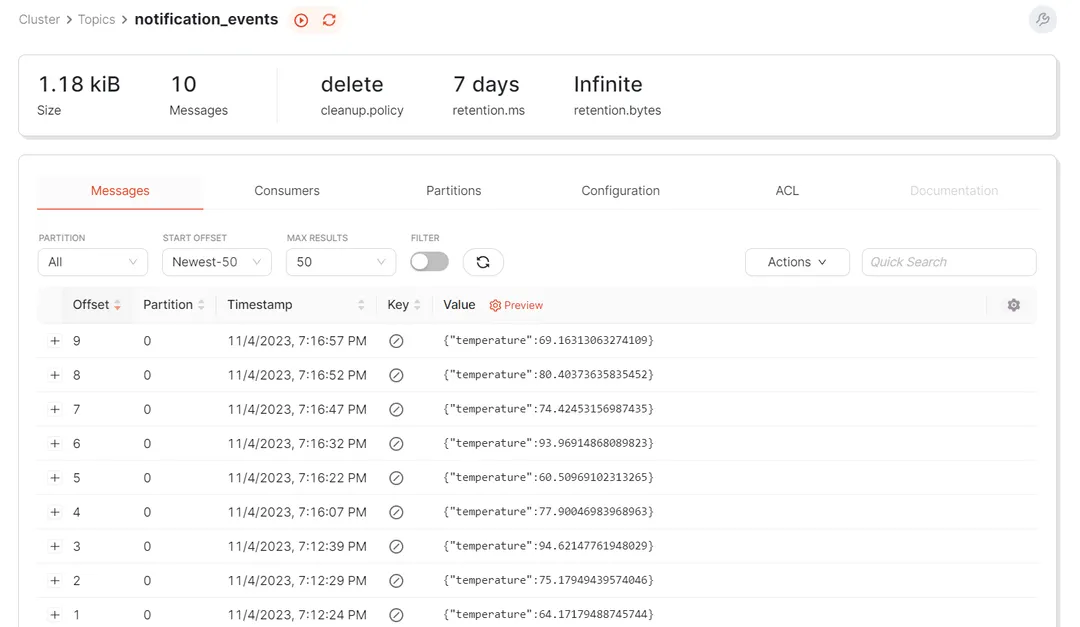
Similarly, access the notification_events topic to view its data. This topic contains only the temperature readings that exceed a value of 60 that are produced by the Flink streaming query:
In this tutorial, you learned how Flink can be used with Redpanda to build a real-time IoT monitoring system. You can use this knowledge to apply the power of Flink and Redpanda for real-time data processing and analysis, which opens up possibilities for various applications such as fraud detection, rule-based alerting, anomaly detection, and more.
With this foundation, you're well on your way to exploring more complex use cases and harnessing the full potential of these powerful tools!
The full code from this tutorial is available in this GitHub repository. To keep exploring Redpanda, check the documentation and browse the Redpanda blog for more tutorials. If you have any questions, ask away on the Redpanda Community on Slac
Apache Flink® is a powerful framework that facilitates the seamless processing of massive amounts of data with low latency. Flink is a vital component of many streaming data systems and is also a versatile tool for many use cases, including fraud detection, rule-based alerting, anomaly detection, real-time IoT monitoring, traffic analytics, and more.
Subscribe to our VIP (very important panda) mailing list to pounce on the latest blogs, surprise announcements, and community events!
Opt out anytime.