Full CDC semantics land in the Iceberg output for Redpanda Connect
Your lakehouse mirrors the database, instantly.

Power up your data streaming performance in BigQuery with our fast, scalable, and fully-managed Redpanda Cloud


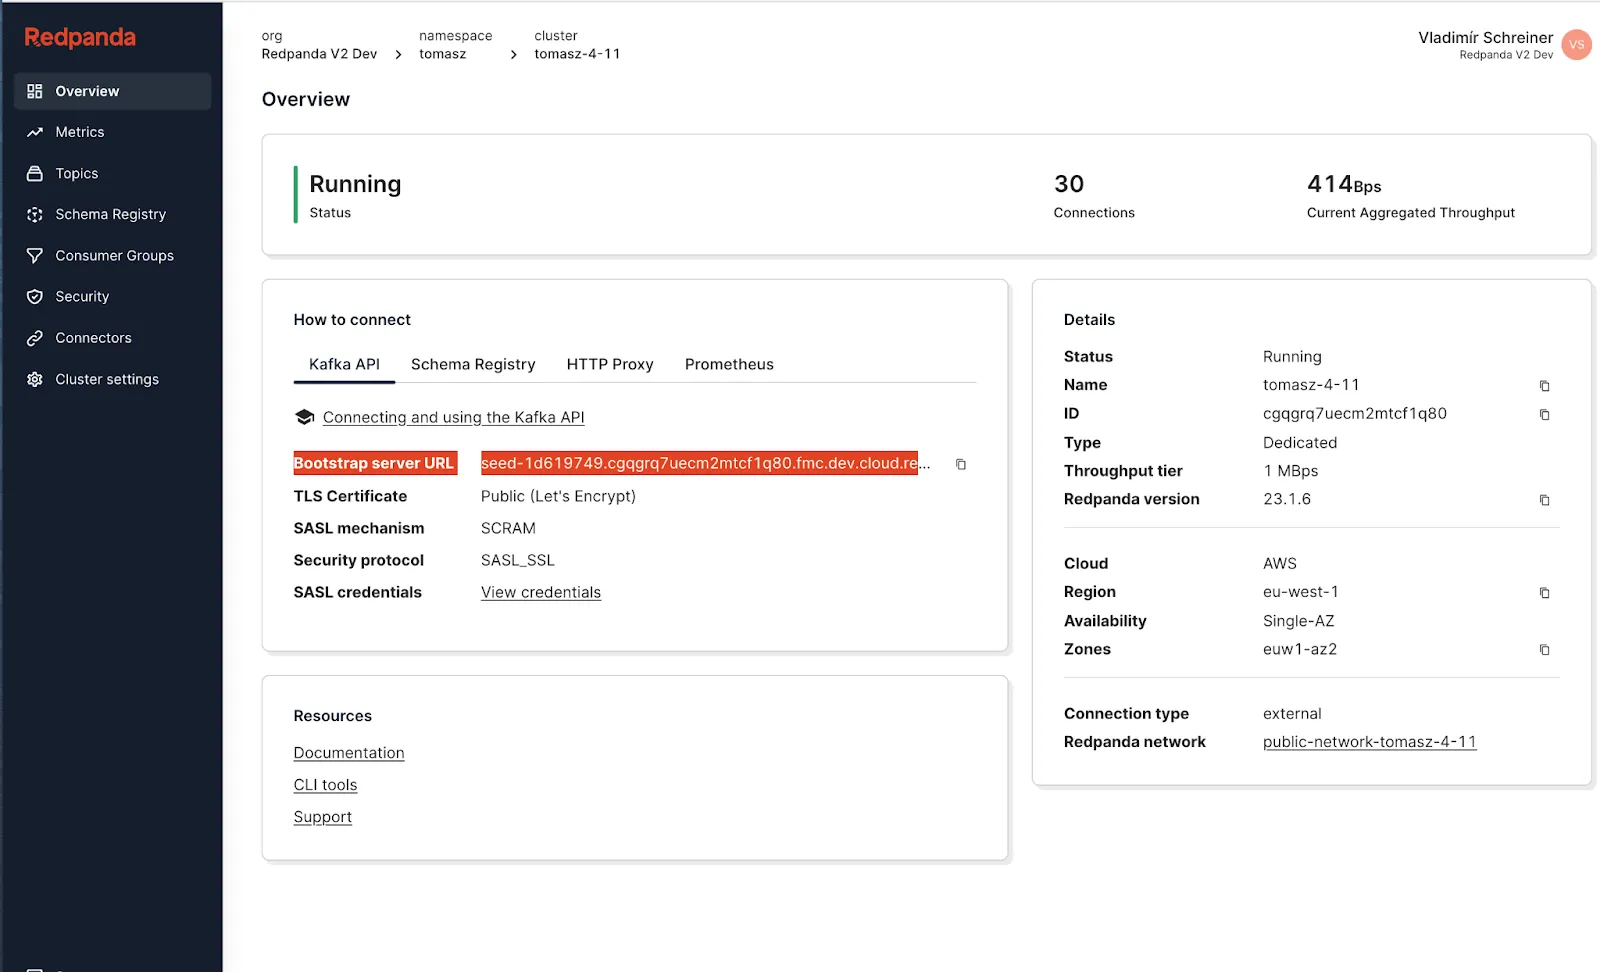
To set up Redpanda and BigQuery, you need to create a data set and a table in BigQuery, create a service account with the BigQuery Admin role, and create a service account key. In Redpanda, log in to Redpanda Cloud, note the Bootstrap server URL, create a topic within Redpanda, and create the connector. You also need to set up the service user and ACLs in Redpanda to access the Redpanda topic programmatically.
Redpanda provides a new Cloud connector for Google BigQuery for automated and fully-managed data integration. You can stream any structured data via Redpanda and write it in a BigQuery table in real time. This data is then ready to be analyzed for any number of use cases.
Redpanda enhances the data streaming pipeline by allowing applications to connect to the streaming data, simplifying streaming integration by making it fully managed, and enabling pre-processing, transformation, filtering, or enrichment of streaming data before writing it to BigQuery. It also manages message schema policies to ensure incoming streams only contain messages with a defined structure.
Redpanda enhances the ingestion process in streaming data architectures by directly servicing applications with real-time streaming data, while historical data is channeled downstream to powerful analytical systems like Google BigQuery. This allows users to perform comprehensive data analysis, including interactive analytics, business intelligence, and predictive analytics with machine learning.
A frequent pattern for streaming data architectures is to “sink” data streams to long-term storage for analytics and archival. For this, many data analysts, data scientists, and business intelligence professionals prefer Google BigQuery—a cloud-based data warehouse that can handle petabyte-scale data warehousing and analysis.
Redpanda enhances the ingestion process by directly servicing applications with the streaming data for a real-time experience, while historical data is channeled downstream to powerful analytical systems like Google BigQuery. This enables users to easily perform comprehensive data analysis, including interactive analytics, business intelligence, and predictive analytics with machine learning.
Redpanda is a high-performance, Apache Kafka®-compatible streaming data platform available as a fully-managed service on Google Cloud Platform (GCP). To make it easier for you to pipe data from Redpanda to your preferred data service, we recently released a new Redpanda Cloud connector for Google BigQuery for automated and fully-managed data integration.
You can stream any structured data via Redpanda and write it in a BigQuery table in real time—ready to be analyzed for any number of use cases.
By combining Redpanda's real-time data processing capabilities with BigQuery's robust analytical features, organizations can unlock the full potential of their data and drive informed decision-making. In this post, we’ll show you how to stream data from Redpanda to BigQuery for advanced analytics.
Redpanda Cloud allows users to experience a fully-managed and scalable solution for seamlessly ingesting large volumes of streaming data into Google BigQuery. It essentially represents an alternative to directly writing data streams to BigQuery using the write API.
Redpanda adds power to the streaming pipeline so you can:
Next, we’ll walk through an example scenario where you’ll learn how to use Redpanda Cloud to ingest streaming data into BigQuery, then run SQL queries on BigQuery for data analysis.
In this scenario, the goal is to find the ID of the user who visited a classified ad more than 5,000 times after January 1, 2020. Multiple users visited these ads, so you must pick the classified ad with the maximum ID.
The following table explains the criteria you need to find the matching user ID:
Criteria
Visit Count > 5000
Last Visit Date > January 1, 2020
Max. Classified Ad ID
The stream contains the data of user visits for different classified ads on various dates and times. Here’s an example of said data:
...output omitted...
{"userId": 6130, "classifiedId": 6626, "visitCount": 7273, "lastVisitDate": "2019-12-05T16:13:36"}
{"userId": 6065, "classifiedId": 2128, "visitCount": 8234, "lastVisitDate": "2020-11-10T03:35:26"}
{"userId": 79, "classifiedId": 4056, "visitCount": 7608, "lastVisitDate": "2018-06-01T05:17:58"}
...output omitted...First, let’s set up BigQuery's GCP data streaming. You can find a more detailed guide in our blog post on Streaming to BigQuery with Redpanda, but here’s the short version:
classified-ad-visitsclassified-ad-visits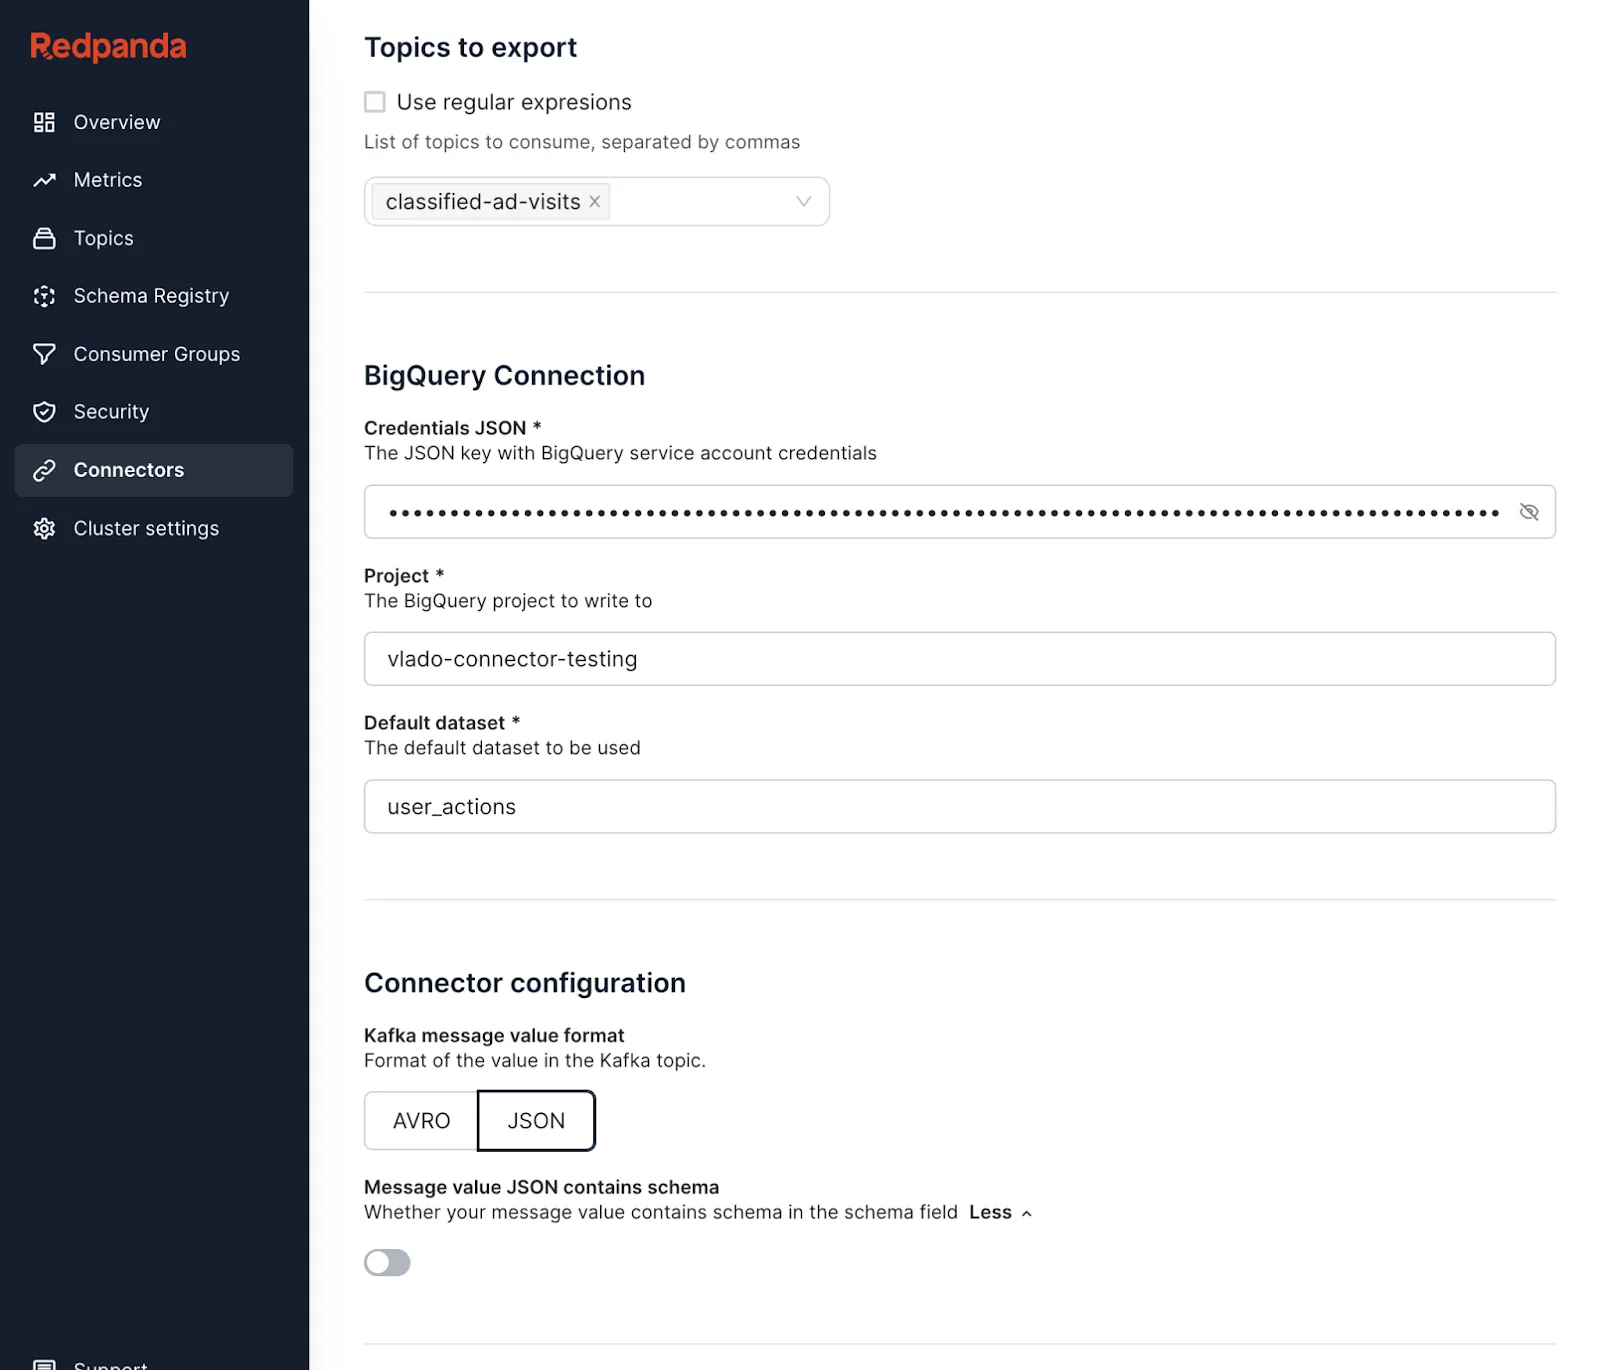
Here’s a preview of what you should see:
You need to set up the service user and ACLs in Redpanda to access the Redpanda topic programmatically:
classified-ad-visits topic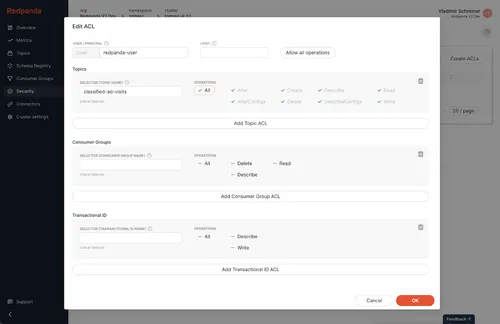
It’s time to produce data from a JSON file to the Redpanda topic by using the rpk CLI. Data will be automatically fed to the BigQuery table.
At this point, you have the Redpanda cluster with a topic called classified-ad-visits and you’ve configured your BigQuery project with the classified-ad-visits table in the user_actions data set.
Download the JSON file with sample data to simulate users’ classified ad actions. Name the file classified-ad-visits-data.json. The downloaded file content should look like the following:
...output omitted...
{"userId": 6130, "classifiedId": 6626, "visitCount": 7273, "lastVisitDate": "2019-12-05T16:13:36"}
{"userId": 6065, "classifiedId": 2128, "visitCount": 8234, "lastVisitDate": "2020-11-10T03:35:26"}
{"userId": 79, "classifiedId": 4056, "visitCount": 7608, "lastVisitDate": "2018-06-01T05:17:58"}
...output omitted…
Run the following command to produce the messages to Redpanda using rpk:
rpk topic produce classified-ad-visits --brokers 'BOOTSTRAP_SERVER_URL:PORT' --tls-enabled --user 'redpanda-user' --password 'SERVICE_USER_PASSWORD' --sasl-mechanism 'SCRAM-SHA-256' < classified-ad-visits-data.json
The following output indicates that you successfully sent 20,000 records to Redpanda in a few seconds:
...output omitted...
Produced to partition 0 at offset 19992 with timestamp 1649194465989.
Produced to partition 0 at offset 19993 with timestamp 1649194465989.
Produced to partition 0 at offset 19994 with timestamp 1649194465989.
Produced to partition 0 at offset 19995 with timestamp 1649194465989.
Produced to partition 0 at offset 19996 with timestamp 1649194465989.
Produced to partition 0 at offset 19997 with timestamp 1649194465989.
Produced to partition 0 at offset 19998 with timestamp 1649194465989.
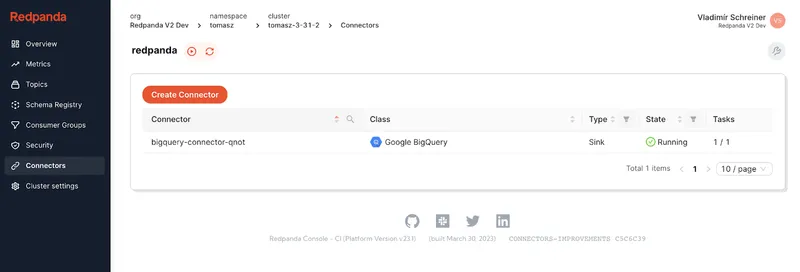
Produced to partition 0 at offset 19999 with timestamp 1649194465989.Lastly, you can check the content of the classified-ad-visits topic via Redpanda Cloud UI.
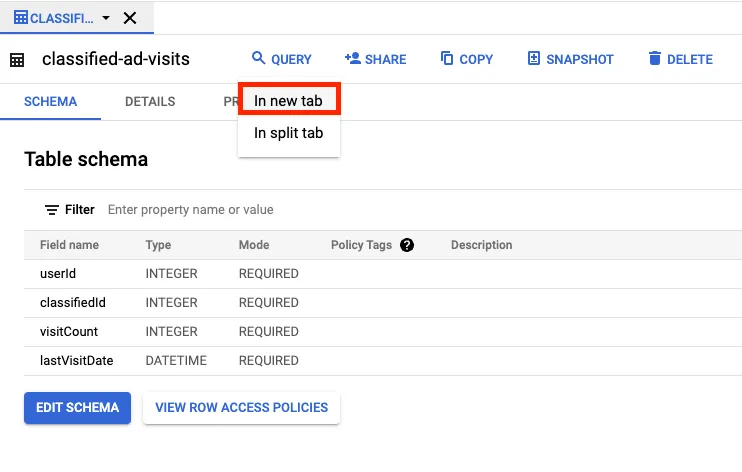
The same number of records must be sent to BigQuery. To verify this, navigate back to your BigQuery project in your browser and click the table classified-ad-visits in the Explorer section. Click Query > In new tab to open a tab where you can run queries against your table.
Open the Query editor in a new tab, and then run the following query to verify the record count in your BigQuery table. Replace _YOUR_PROJECT_ID_ with your pandaq project ID that looks like this: pandaq-xxxxxx:
SELECT count(*) FROM `_YOUR_PROJECT_ID_.user_actions.classified-ad-visits`
On the opened Query results section, you should see the result as 20,000. To find the user ID that the organizer needs, use the following table and write the SQL command.
Table Field
Value
Visit Count
> 5000
Last Visit Date
> Jan 1, 2020
Classified Ad ID
Max.
The SQL command is as follows:
select max(classifiedId)
  from `_YOUR_PROJECT_ID_.user_actions.classified-ad-visits`
where visitCount > 5000
  and lastVisitDate > cast('2020-01-01 00:00:00' as datetime)
This should return 10,000 as the maximum of the classified IDs later than the relevant date. With this information, you can find the user who visited the classified ad more than 5,000 times with the ID 10,000, after the date Jan 1, 2020.
Run the following query in the same Query window to find the user ID:
select userId
  from `_YOUR_PROJECT_ID_.user_actions.classified-ad-visits`
where visitCount > 5000
  and lastVisitDate > cast('2020-01-01 00:00:00' as datetime)
  and classifiedId = 10000
On the Query results section, you can see the user ID as 9328. If you found the same user ID, congratulations! You’ve just completed the demo scenario successfully.
In this post, you learned how easy it is to use Redpanda Cloud to ingest streaming data into BigQuery, then run SQL queries on BigQuery to analyze your data.
If you benefit from a fully-automated Redpanda and BigQuery integration, you can stream large amounts of data, write them in a table in real time, and keep your data ready to be analyzed for any number of use cases.
To keep learning about Redpanda, try Redpanda Cloud for free! You can check out our documentation and browse the Redpanda blog for more tutorials. If you have questions or want to chat with our engineers and fellow Redpanda users, join the Redpanda Community on Slack.
Subscribe to our VIP (very important panda) mailing list to pounce on the latest blogs, surprise announcements, and community events!
Opt out anytime.