Capture and move sales data to BigQuery with Redpanda and Flink
Learn how to build a sales CDC pipeline with Debezium, Flink, and the simplest Kafka alternative

Change data capture (CDC) is a process that identifies and captures the changes made to the data in a database. It can identify the added, updated, or deleted records in a database and move those changes to different storage systems, including data warehouses, caches, and search indexes, to support different use cases.
CDC's primary goal is to track and record changes in data, providing a more comprehensive audit trail of the who, what, and when of each change. This tracking ensures dependable synchronization so organizations can consistently monitor and transfer record modifications, additions, or deletions across systems. CDC operates seamlessly with both real-time (streaming) and batch data, employing two main capture mechanisms:
- Log-based CDC: using database transaction logs
- Timestamp-based tracking: identifying changes based on record timestamps
Some common CDC use cases include:
- Monolith to microservices migration: CDC facilitates real-time or near-real-time data synchronization between monolithic databases and microservices during architectural transitions, ensuring data consistency.
- Event-driven application development: CDC enables the capture and dissemination of changes as events, facilitating the implementation of event-driven applications. For example, database changes can trigger events consumed by other services.
In this post, you'll learn how to build an efficient data pipeline for sales data with the help of Debezium, Apache Flink®, and Redpanda — a simpler, JVM-free drop-in Kafka replacement.
How to capture and move sales data to BigQuery with Redpanda and Flink
CDC has various applications but is especially popular for building data pipelines at different scales. Data pipelines transform data and move it from a source to a sink. CDC can help build data pipelines by capturing the changes in the source data that can then be used for other tasks, such as downstream analytics, reporting, or further transformation. CDC ensures the end system receives only relevant and current data, reducing latency and resource consumption.
Now, consider a scenario where you've decided to build a data pipeline to transfer sales data from a MySQL database to a BigQuery data warehouse. You're transferring the data to BigQuery to improve performance, scalability, real-time analytics, and security and compliance while also ensuring data preprocessing conveys only pertinent information to the final system.
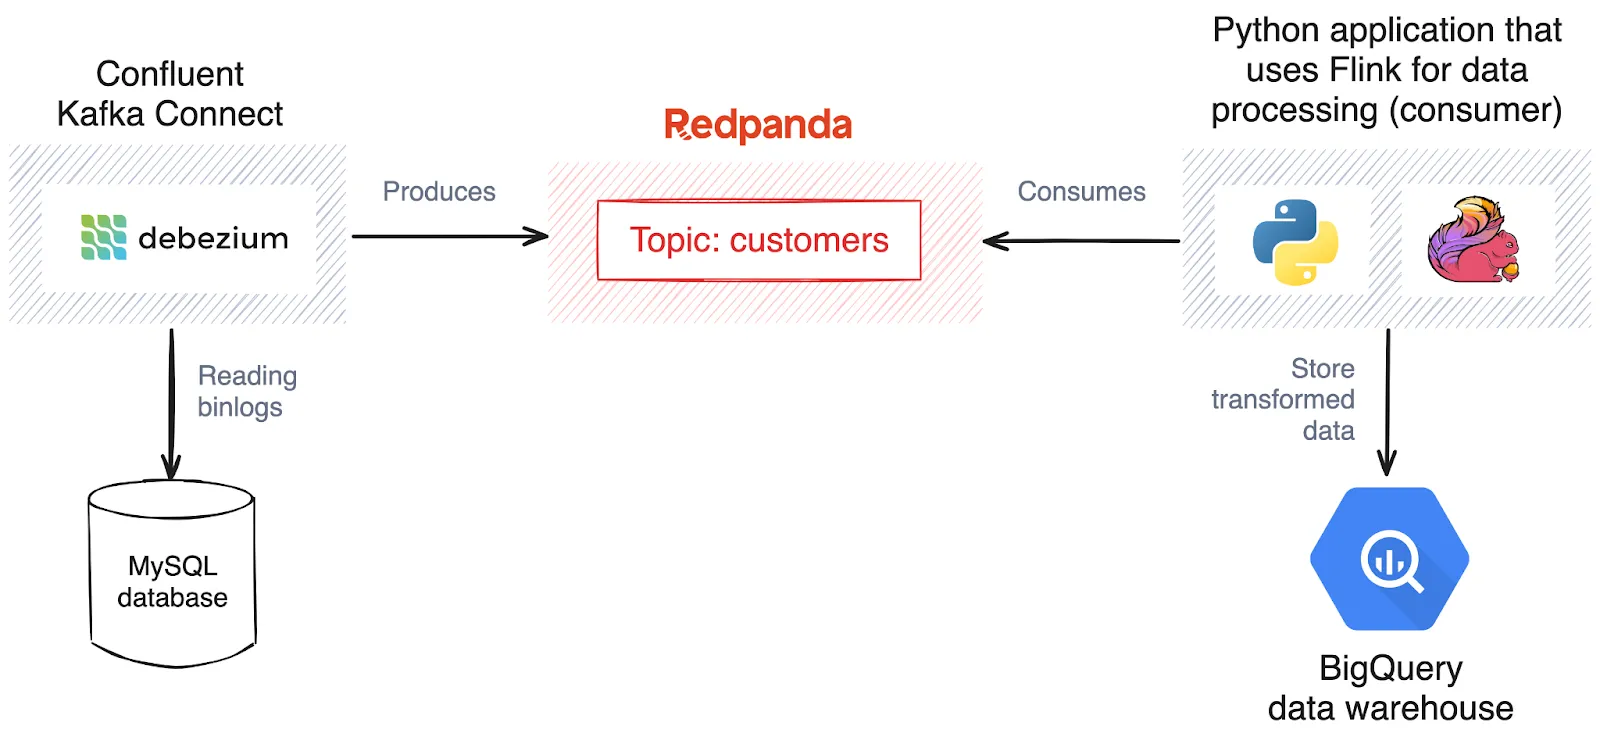
In this pipeline, Debezium captures MySQL changes and transfers the data to a Redpanda topic. Flink then performs preprocessing on this data before writing it to the BigQuery data warehouse.

Architecture diagram
For this tutorial, you don't need to download the data or store it in the MySQL database since you'll use a MySQL Docker image that already has sales data. If you want to skip ahead, all the code lives in this GitHub repository.
Prerequisites
You'll need the following to complete the tutorial:
- Docker or Docker Desktop
- A GCP account for accessing BigQuery and a BigQuery table set up (it can be named anything you want)
- Python 3.11
- A virtual environment for Python development, which should be activated before any use throughout the tutorial
- A project folder named something like
Sales_Change_Data_Capture
1. Run MySQL, Redpanda, and Debezium services
You'll first create the services using Docker Compose. The images for the services are provided, so you'll already have the required data for the MySQL database to complete the tutorial.
Note that MySQL, Debezium, and Redpanda all need to be on the same Docker network.
To set up the images on the same network, open a terminal, navigate to your project folder location, and run the following command to create a Docker Compose file containing the configurations:
mkdir debezium && cd debezium && touch redpanda-debezium.compose.yml
Once the file is created, you need to alter it as follows:
# redpanda-debezium.compose.yml
version: "3.3"
services:
  redpanda:
    image: vectorized/redpanda
    ports:
      - "9092:9092"
      - "29092:29092"
    command:
      - redpanda
      - start
      - --overprovisioned
      - --smp
      - "1"
      - --memory
      - "1G"
      - --reserve-memory
      - "0M"
      - --node-id
      - "0"
      - --kafka-addr
      - PLAINTEXT://0.0.0.0:29092,OUTSIDE://0.0.0.0:9092
      - --advertise-kafka-addr
      - PLAINTEXT://redpanda:29092,OUTSIDE://redpanda:9092
      - --check=false
  connect:
    image: debezium/connect
    depends_on:
      - redpanda
    ports:
      - "8083:8083"
    environment:
      BOOTSTRAP_SERVERS: "redpanda:9092"
      GROUP_ID: "1"
      CONFIG_STORAGE_TOPIC: "inventory.configs"
      OFFSET_STORAGE_TOPIC: "inventory.offset"
      STATUS_STORAGE_TOPIC: "inventory.status"
  mysql:
    image: debezium/example-mysql:1.6
    ports:
      - "3306:3306"
    environment:
      MYSQL_ROOT_PASSWORD: debezium
      MYSQL_USER: mysqluser
      MYSQL_PASSWORD: mysqlpw
As you can see, the above file contains configurations for three different Docker services. You can learn more about the environment variables used in these images on Docker Hub.
Next, you need to run the docker-compose up command to run the services:
docker-compose -f redpanda-debezium.compose.yml up -d
The -f argument specifies the file that can be used to create the Docker images.
Run the following command to access the running Redpanda container and verify the topics have been created:
docker exec -it debezium-redpanda-1 \
rpk topic list
Name Partitions Replicas
inventory.configs 1 1
inventory.offset 25 1
inventory.status 5 1You can test the MySQL service image by listing out the databases and tables. To do so, access the MySQL shell as follows:
docker exec -it debezium-mysql-1 /bin/bashIn the opened container shell, select the inventory database with the help of the following SQL statement:
use inventory;To verify different tables in the inventory database, you can use the show statement from SQL:
show tables;
+---------------------+
| Tables_in_inventory |
+---------------------+
| addresses           |
| customers           |
| geom                |
| orders              |
| products            |
| products_on_hand    |
+---------------------+
Finally, to verify the content in the customers table, you can use the select statement from SQL as follows:
select * from customers;
+------+------------+-----------+-----------------------+
| id   | first_name | last_name | email                 |
+------+------------+-----------+-----------------------+
| 1001 | Sally      | Thomas    | sally.thomas@acme.com |
| 1002 | George     | Bailey    | gbailey@foobar.com    |
| 1003 | Edward     | Walker    | ed@walker.com         |
| 1004 | Anne       | Kretchmar | annek@noanswer.org    |
+------+------------+-----------+-----------------------+
4 rows in set (0.00 sec)
4 rows in set (0.00 sec)
This is all the setup and testing that you need to do to capture the changed data from MySQL.
2. Capture the changes
Kafka Connect exposes the REST API that allows you to upload the configuration parameters. To capture the change data, you need to send the following configurations to Kafka Connect:
curl --request POST \
  --url http://localhost:8083/connectors \
  --header 'Content-Type: application/json' \
  --data '{
  "name": "inventory-connector",
  "config": {
    "connector.class": "io.debezium.connector.mysql.MySqlConnector",
    "tasks.max": "1",
    "database.hostname": "mysql",
    "database.port": "3306",
    "database.user": "debezium",
    "database.password": "dbz",
    "database.server.id": "184054",
    "database.server.name": "dbserver1",
    "database.include.list": "inventory",
    "database.history.kafka.bootstrap.servers": "redpanda:9092",
    "database.history.kafka.topic": "schema-changes.inventory"
  }
}'
Let's break down the structure of the above command:
curlis the command line tool for making HTTP requests.--request POSTspecifies that the HTTP request should be a POST request.--url http://localhost:8083/connectorsspecifies the URL where the request should be sent. In this case, it's the endpoint for creating connectors in the Apache Kafka Connect framework.--header 'Content-Type: application/json'specifies the content type of the data being sent in the request body as JSON.--datais the actual data being sent in the request body. In this case, it's a JSON payload specifying the configuration for a new connector instance.namespecifies the name of the connector instance to be created. In this case, it's set toinventory-connector.configdefines a set of configuration settings for the connector. Each key-value pair within theconfigobject corresponds to a specific configuration property for the Debezium MySQL connector.connector.classspecifies the connector class, indicating that the Debezium MySQL connector should be used.tasks.maxsets the maximum number of tasks for the connector. In this case, it's limited to one task.database.hostnamespecifies the hostname of the MySQL database.database.portspecifies the port number on which the MySQL database is running.database.userspecifies the username for connecting to the MySQL database.database.passwordspecifies the password for the MySQL user.database.server.idsets a unique identifier for the MySQL server.database.server.nameassigns a name to the MySQL server.database.include.listspecifies the MySQL database(s) to include in the change data capture process.database.history.kafka.bootstrap.serversspecifies the bootstrap servers for the Kafka cluster used to store database schema changes.database.history.kafka.topicdefines the Kafka topic where schema changes are recorded.
As soon as you run the command, the Kafka Connect connector setup completes, and it starts reading the binlogs from MySQL and streaming changes to Redpanda.
Kafka Connect creates different topics for each table present in the MySQL database. However, in this tutorial, you only need to focus on the dbserver1.inventory.customers table, as this is the one you'll use for CDC and sending the changed data to BigQuery. To check the captured data, you simply need to run the following command:
docker exec -it debezium-redpanda-1 \
rpk topic consume dbserver1.inventory.customers
{
"schema": {
"type": "struct",
"fields": [ ... ],
"optional": false,
"name": "dbserver1.inventory.customers.Envelope"
},
"payload": {
"before": null,
"after": {
"id": 1004,
"first_name": "Anne",
"last_name": "Kretchmar",
"email": "annek@noanswer.org"
},
"source": {
"version": "1.6.1.Final",
"connector": "mysql",
"name": "dbserver1",
"ts_ms": 1630246982521,
"snapshot": "true",
"db": "inventory",
"sequence": null,
"table": "customers",
"server_id": 0,
"gtid": null,
"file": "mysql-bin.000008",
"pos": 154,
"row": 0,
"thread": null,
"query": null
},
"op": "r",
"ts_ms": 1630246982521,
"transaction": null
}
}You can now capture the changes from MySQL to the Redpanda topic. As soon as you make a change in the MySQL table, it will be transferred to the Redpanda topic.
3. Use Flink for data processing and send the processed data to BigQuery
You'll now use Apache Flink to preprocess the captured data, which you'll then send to the BigQuery data warehouse.
You'll first need to activate the virtual environment and install dependencies to use Apache Flink and Kafka clients within the environment:
pip install apache-flink pyflink confluent-kafka
Next, create a file named Flink_Data_Processor.py in your project folder (Sales_Change_Data_Capture or whatever you named it) and import the necessary modules from the Flink library:
from pyflink.datastream import StreamExecutionEnvironment
from pyflink.table import StreamTableEnvironment, CsvTableSink, DataTypes
from pyflink.table.descriptors import Kafka, FileSystem
You also need to initialize the Flink execution environment and the Flink table environment, which are necessary for configuring and executing Flink jobs:
# Set up Flink execution environment and table environment
env = StreamExecutionEnvironment.get_execution_environment()
t_env = StreamTableEnvironment.create(env)
Once done, you need to add several lines of code to configure Redpanda properties for connecting to the Redpanda cluster. This configuration includes information such as the bootstrap servers, consumer group ID, and offset reset strategy:
# Define Redpanda source properties
redpanda_properties = {
    'bootstrap.servers': 'redpanda-broker:9092',
    'group.id': 'flink-consumer-group',
    'auto.offset.reset': 'latest'
}
You then need to append the following lines of code to configure BigQuery as your sink:
# Define BigQuery sink properties
bigquery_sink_properties = {
    'connector': 'bigquery',
    'project': 'your-project-id',
    'dataset': 'your-dataset-id',
    'table': 'your-table-id',
    'credentials-file': '/path/to/your/credentials.json'
}
To read data from the specified Redpanda topic and perform some processing—such as aggregating customer counts—prior to storing the results in BigQuery, add the following code to the created file:
# Connect to Redpanda as a source
t_env.connect(Kafka().properties(redpanda_properties))
source_table = t_env.from_kafka('dbserver1.inventory.customers', ['id', 'first_name', 'last_name' 'email'])

# Define your processing logic here
processed_table = source_table.group_by('id').select('id, count(id) as total_customers')
Then, specify the output format and location. In this example, it's creating a temporary CSV sink with the specified delimiter and fields:
# Define BigQuery sink
t_env.connect(FileSystem().path('/tmp/output')) \
    .with_format(CsvTableSink().field_delimiter(',').field('id', DataTypes.STRING()).field('total_customers', DataTypes.DOUBLE())) \
    .create_temporary_table('Result')
Finally, add a line of code to trigger the execution of the Flink job, where the specified job name is FlinkRedpandaBigQueryJob:
# Execute the job
env.execute("FlinkRedpandaBigQueryJob")
The Flink runtime will take care of processing the data stream, applying the defined logic, and writing the results to the specified sink (in this case, a temporary CSV file).
Your final Flink_Data_Processor.py file should look like this:
from pyflink.datastream import StreamExecutionEnvironment
from pyflink.table import StreamTableEnvironment, CsvTableSink, DataTypes
from pyflink.table.descriptors import Kafka, FileSystem

# Set up Flink execution environment and table environment
env = StreamExecutionEnvironment.get_execution_environment()
t_env = StreamTableEnvironment.create(env)

# Define Redpanda source properties
redpanda_properties = {
    'bootstrap.servers': 'redpanda-broker:9092',
    'group.id': 'flink-consumer-group',
    'auto.offset.reset': 'latest'
}

# Define BigQuery sink properties
bigquery_sink_properties = {
    'connector': 'bigquery',
    'project': 'your-project-id',
    'dataset': 'your-dataset-id',
    'table': 'your-table-id',
    'credentials-file': '/path/to/your/credentials.json'
}

# Connect to Redpanda as a source
t_env.connect(Kafka().properties(redpanda_properties))
source_table = t_env.from_kafka('dbserver1.inventory.customers', ['id', 'first_name', 'last_name' 'email'])

# Define your processing logic here
processed_table = source_table.group_by('id').select('id, count(id) as total_customers')

# Define BigQuery sink
t_env.connect(FileSystem().path('/tmp/output')) \
    .with_format(CsvTableSink().field_delimiter(',').field('id', DataTypes.STRING()).field('total_customers', DataTypes.DOUBLE())) \
    .create_temporary_table('Result')

# Execute the job
env.execute("FlinkRedpandaBigQueryJob")
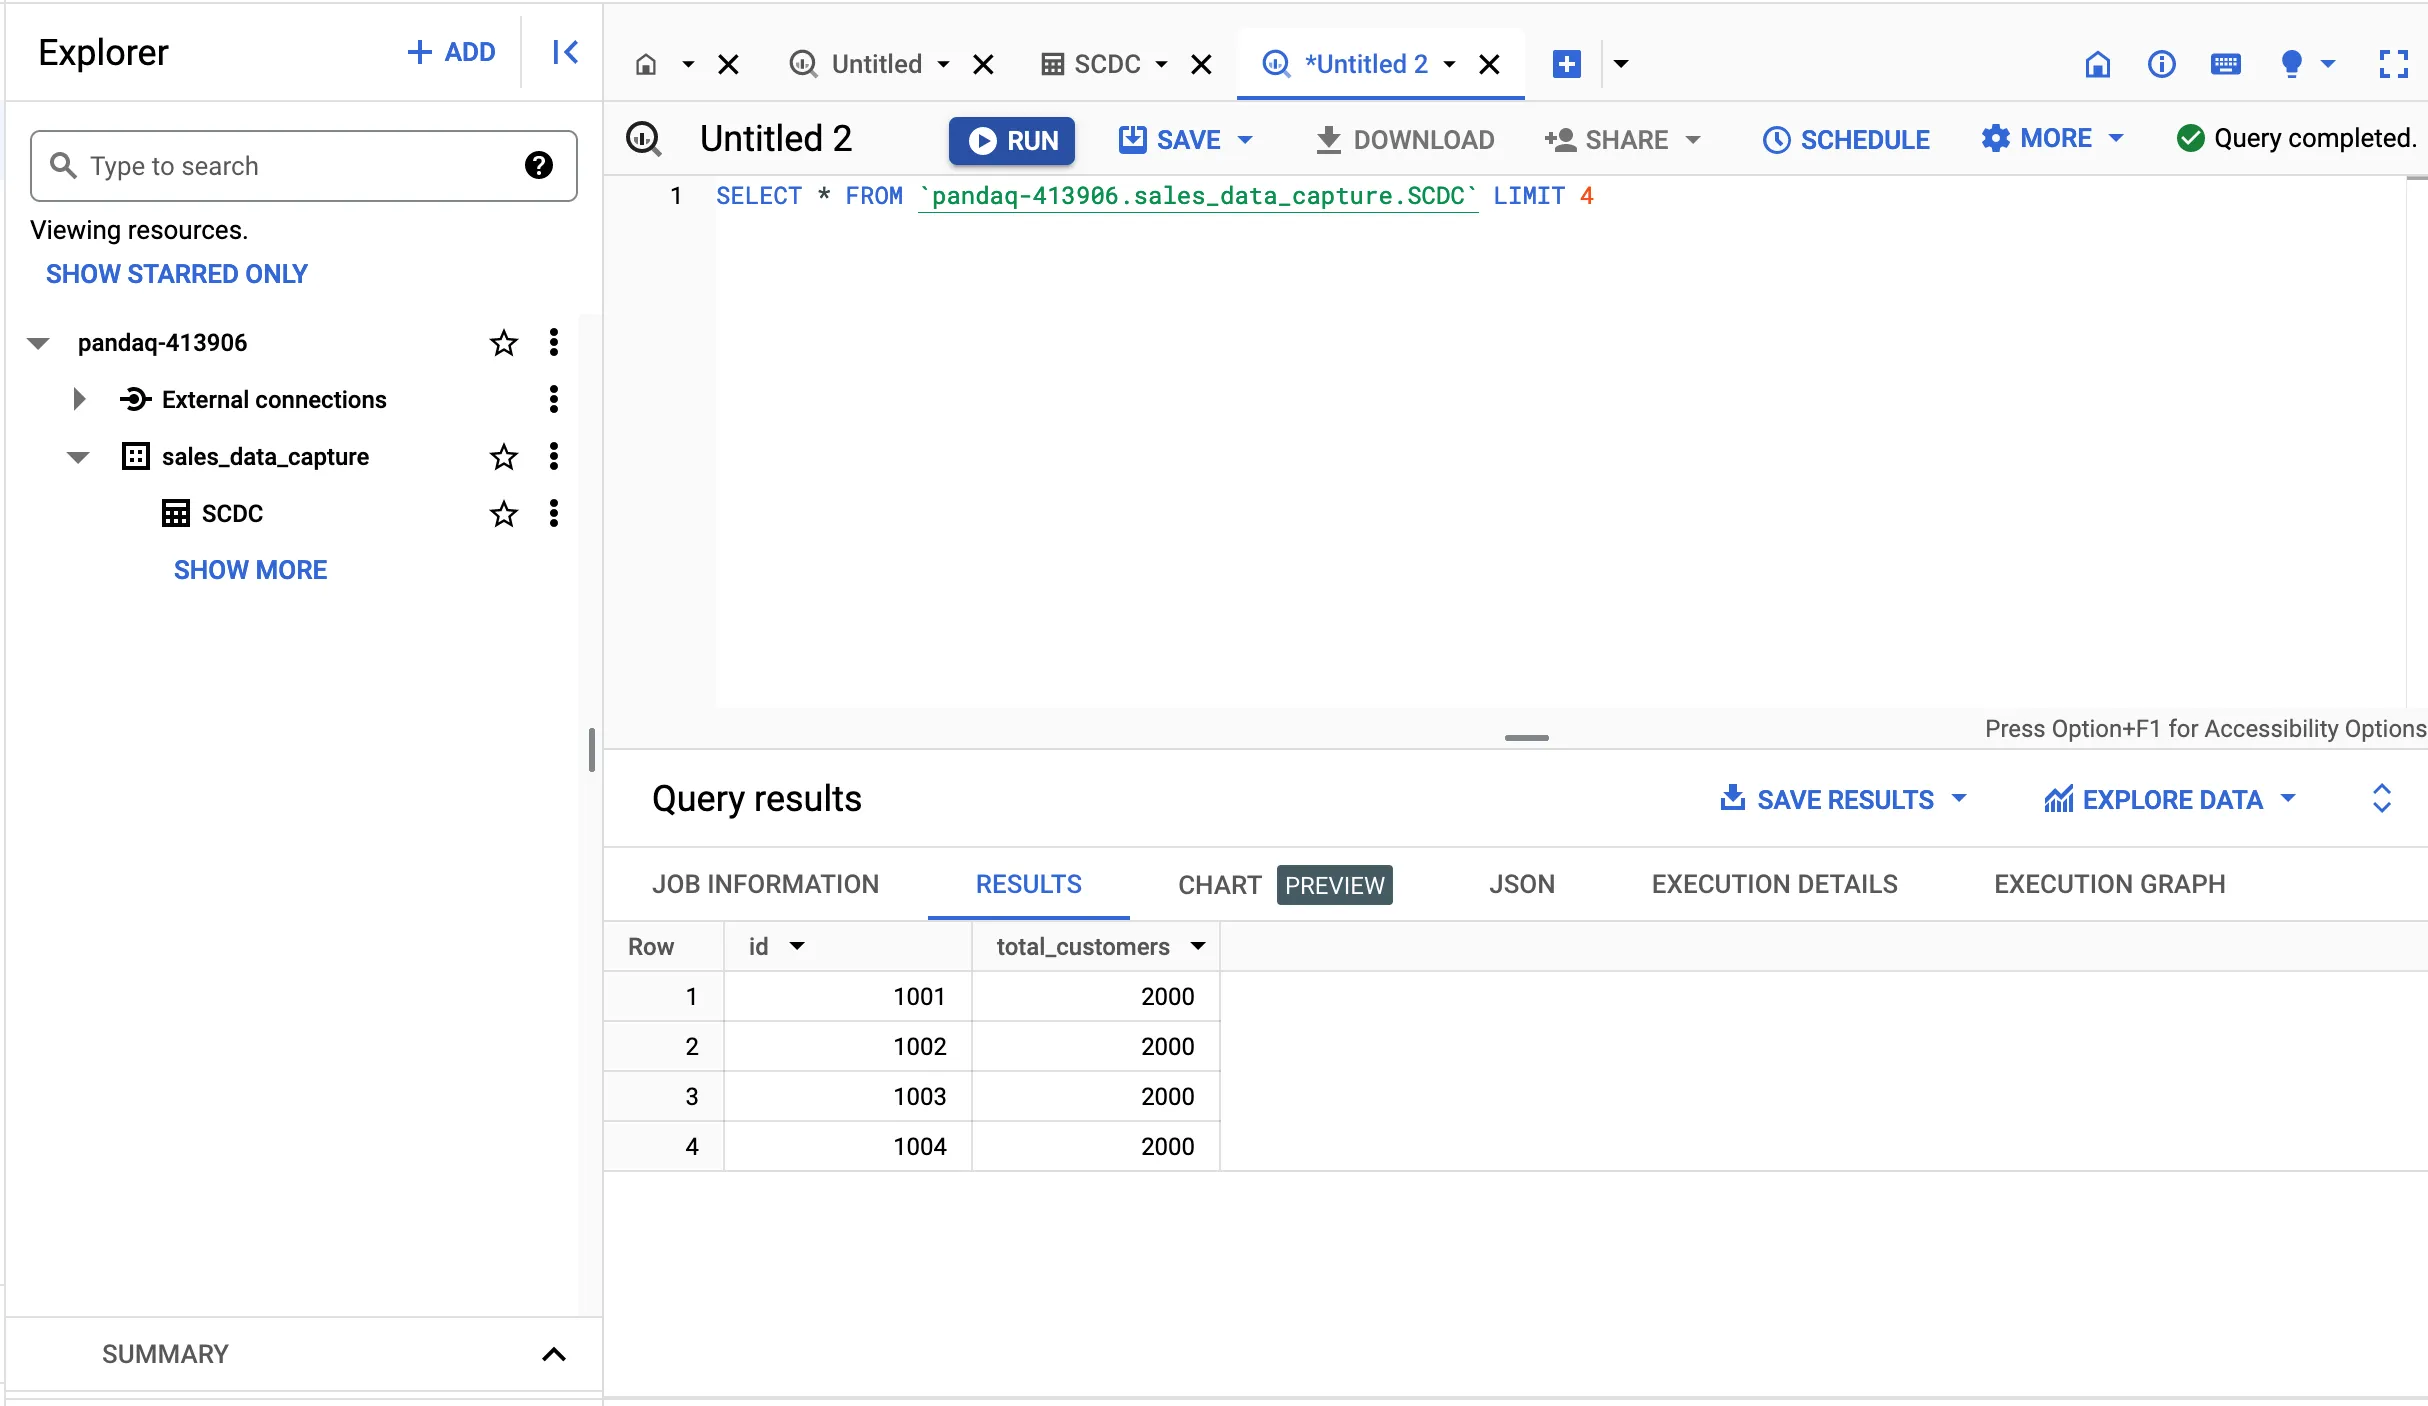
Now, simply run the script with the python Flink_Data_Processor.py command, and your data pipeline will run! If you open the BigQuery dashboard, you should find the new entries. You can query the new entries in BigQuery using a simple SQL select statement:

Conclusion
Congrats! You learned how to implement a sales CDC pipeline with the help of Python, Debezium, Flink, and Redpanda. Apart from MySQL, you can also use CDC with any other database. You can also explore other CDC tools like Talend and StreamSets that can easily be integrated with Redpanda.
The entire code used in this tutorial can be found in this GitHub repository.
To keep playing with Redpanda, sign up for a free trial of Serverless and browse the Redpanda blog for more tutorials. If you have questions or want to chat with the team, join the Redpanda Community on Slack.
Related articles
VIEW ALL POSTSLet's keep in touch
Subscribe and never miss another blog post, announcement, or community event. We hate spam and will never sell your contact information.


