
Building with Redpanda Connect: Bloblang and Claude plugin
A workshop on building and debugging real-world streaming pipelines
System monitoring and optimization made easy with pre-built dashboards
Observability refers to the ability to understand, monitor, and analyze the internal state and behavior of a system from the outside. This is typically done by developers as they run their development projects and by site reliability engineers (SRE) with the primary goal of keeping the systems up, running, and performant. Monitoring and observability are also critical components of Day 2 operations.
Having observability dashboards makes it easy to diagnose, analyze, and resolve issues. It is especially important in modern distributed systems that have multiple moving parts. Most observability tools allow you to set up automated alerts based on predefined thresholds and conditions, usually defined based on use case needs.
When you think of observability, the most commonly used tools that come to mind are Prometheus and Grafana. Prometheus is a system monitoring and alerting tool that collects and stores metrics as time-series data identified by a metric name and key/value pairs. Grafana is a tool to query, visualize, and generate alerts for metrics.
This post walks you through using Prometheus and Grafana to configure observability for Redpanda clusters, producers, and consumers.
Redpanda exports metrics through Prometheus endpoints so you can monitor system health and optimize system performance. A Redpanda broker exports public metrics from the /public_metrics endpoint through the Admin API port (default: 9644).
Redpanda has built a few standard dashboards that can be used to monitor your Redpanda cluster:
These readily available dashboards include charts, graphs, and other visual representations of Redpanda’s state and performance that make it easy to configure observability and can be customized further.
You can find all five dashboards in Redpanda’s Observability Github repository, along with a docker-compose example of setting up a Redpanda cluster with a sample workload. You can also download all five Grafana dashboards for Redpanda and set them up for an existing Redpanda cluster.
Next, we’ll walk you through using the pre-created GitHub repo for observability in Redpanda.
You’ll need Docker and Docker Compose installed on your host machine, which can be a cloud virtual machine or local instance.
1. Clone the repo
git clone https://github.com/redpanda-data/observability.git
2. Go to the demo directory
cd observability/demo
3. Start the Docker containers
docker-compose up -d
4. List the Docker processes to ensure they are all up. Alternatively, if you’re using Docker Desktop you can verify using Docker Desktop as well
docker psThis Docker Compose example starts the following:
The Owl Shop example application simulates a simple e-commerce shop that uses Redpanda as an asynchronous communication exchange. Owl Shop creates topics, produces sample data to those topics, and then consumes from them.
Redpanda Console gives you a simple, interactive approach for gaining visibility into your topics, masking data, managing consumer groups and exploring real-time data with time-travel debugging. The Console is predominantly for developers using Redpanda for local development and testing.
The Prometheus Docker instance is already configured to scrape the public_metrics endpoint from the three-broker Redpanda cluster. The prometheus.yml file, which you can access via the Prometheus Docker container shell, has the following configuration:
- job_name: redpanda
  static_configs:
  - targets:
    - redpanda-0:9644
    - redpanda-1:9644
    - redpanda-2:9644
metrics_path: /public_metricsSeveral Docker containers started in Step 3 can be accessed via URIs. For example, if you started these on your laptop, you can access them via the following URLs:
Redpanda Console: http://localhost:8080/
Prometheus: http://localhost:9090
Grafana: http://localhost:3000
Now that you’ve set up the repo along with Docker containers and have the Owl shop application running, you can monitor the cluster's performance via the pre-built Grafana dashboards, which you can run locally on your laptop, or on Self-Managed or Cloud clusters.
These dashboards are also available on the Grafana website. If you already have an observability stack set up, you can just add the Redpanda dashboards using their IDs.
Going back to our observability example, enter the URI for the Grafana service in your browser. Once you log in, you’ll be led to the home page of Grafana instance. From the toggle menu, access the dashboards already imported into Grafana as part of this repo.
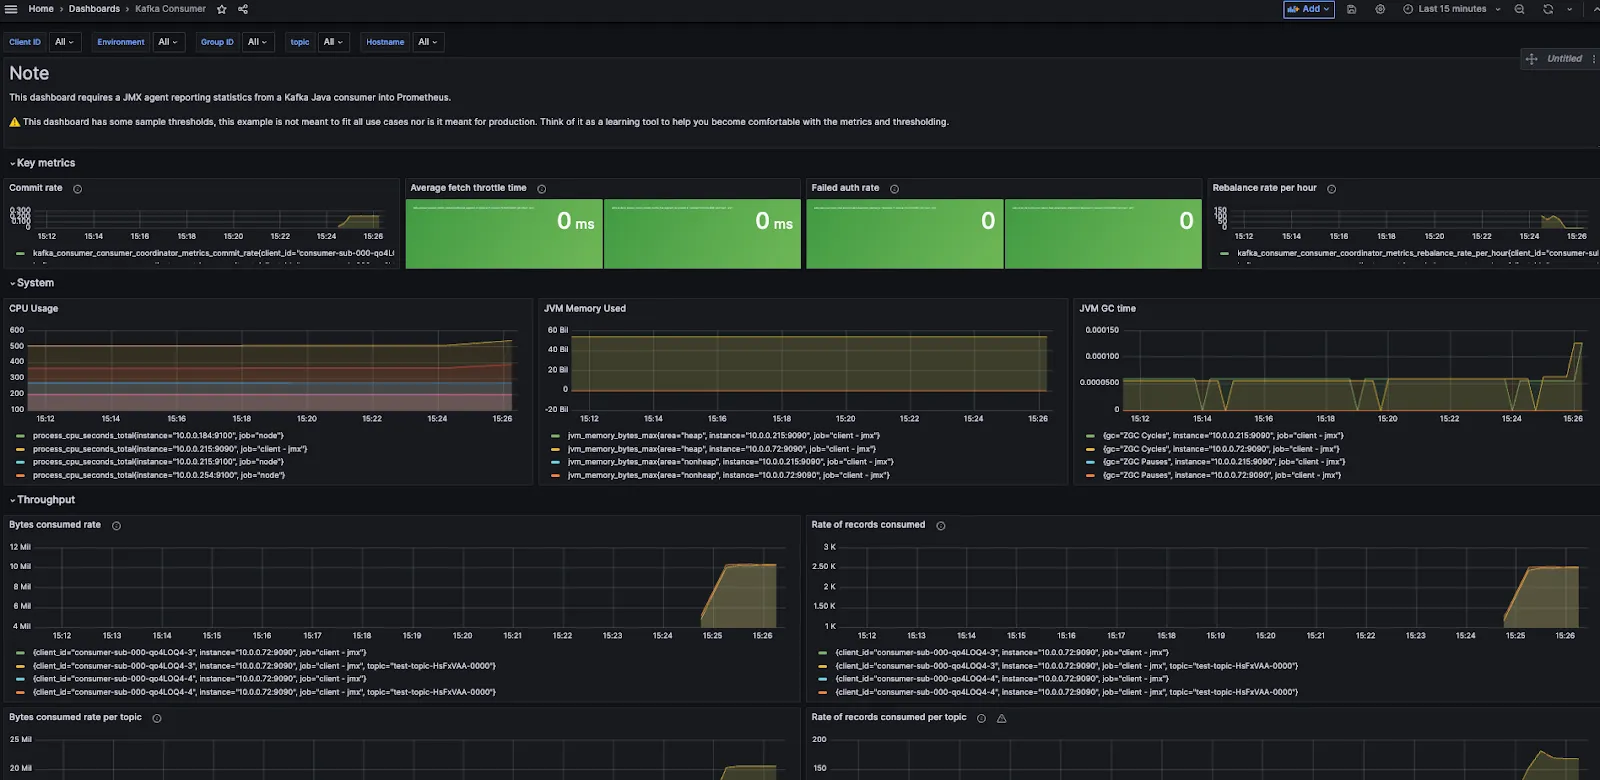
Here are sample screenshots of each dashboard:
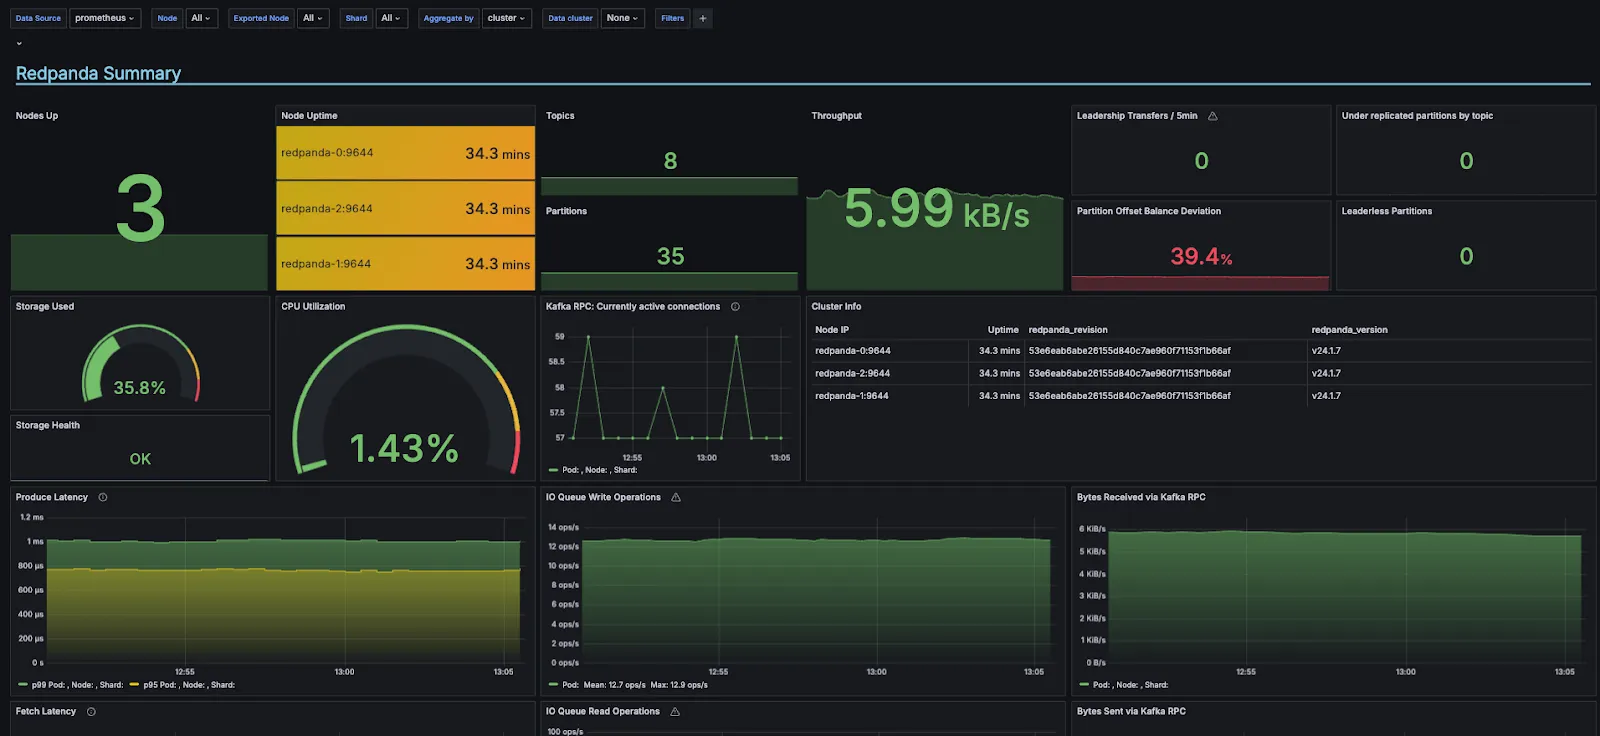
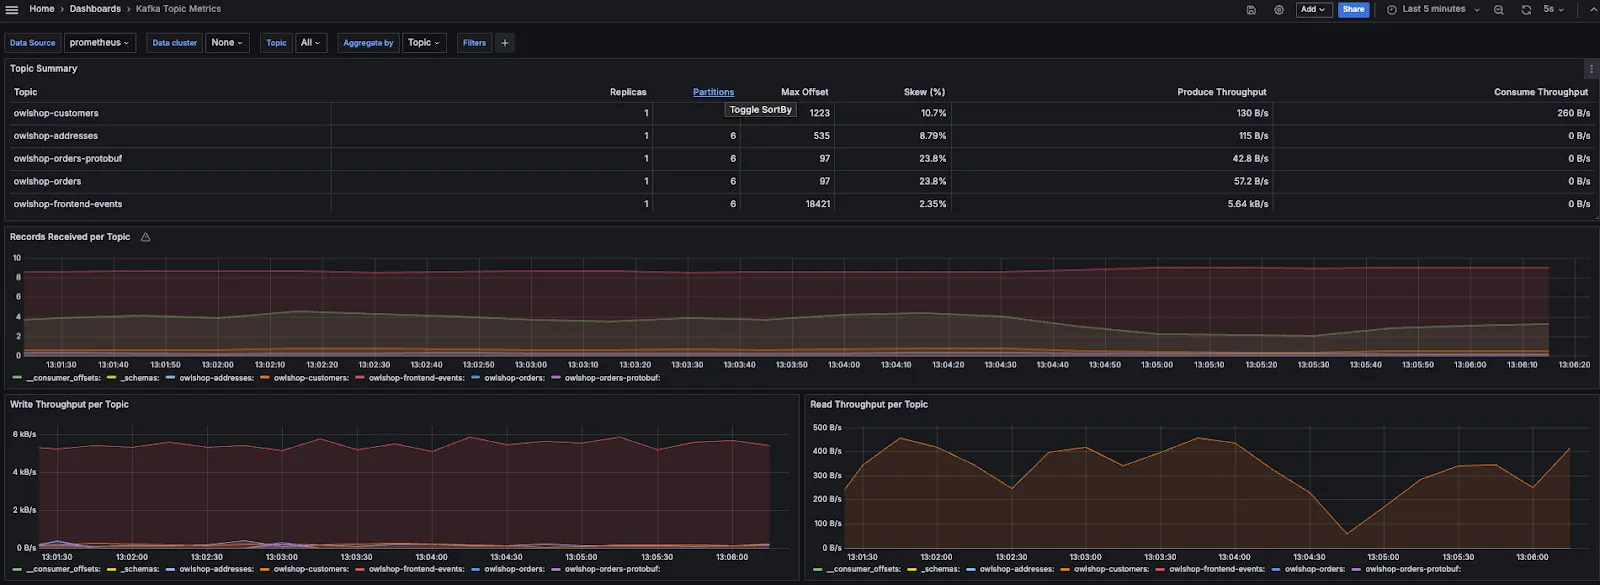
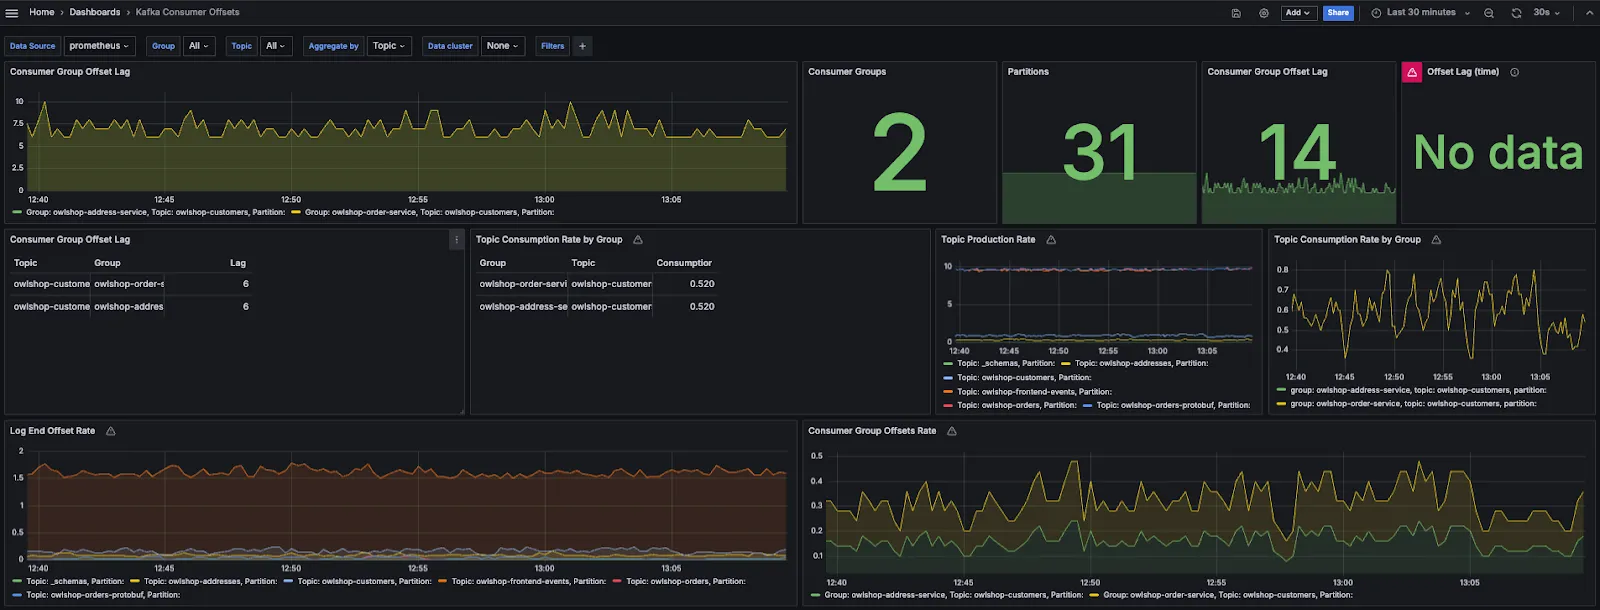
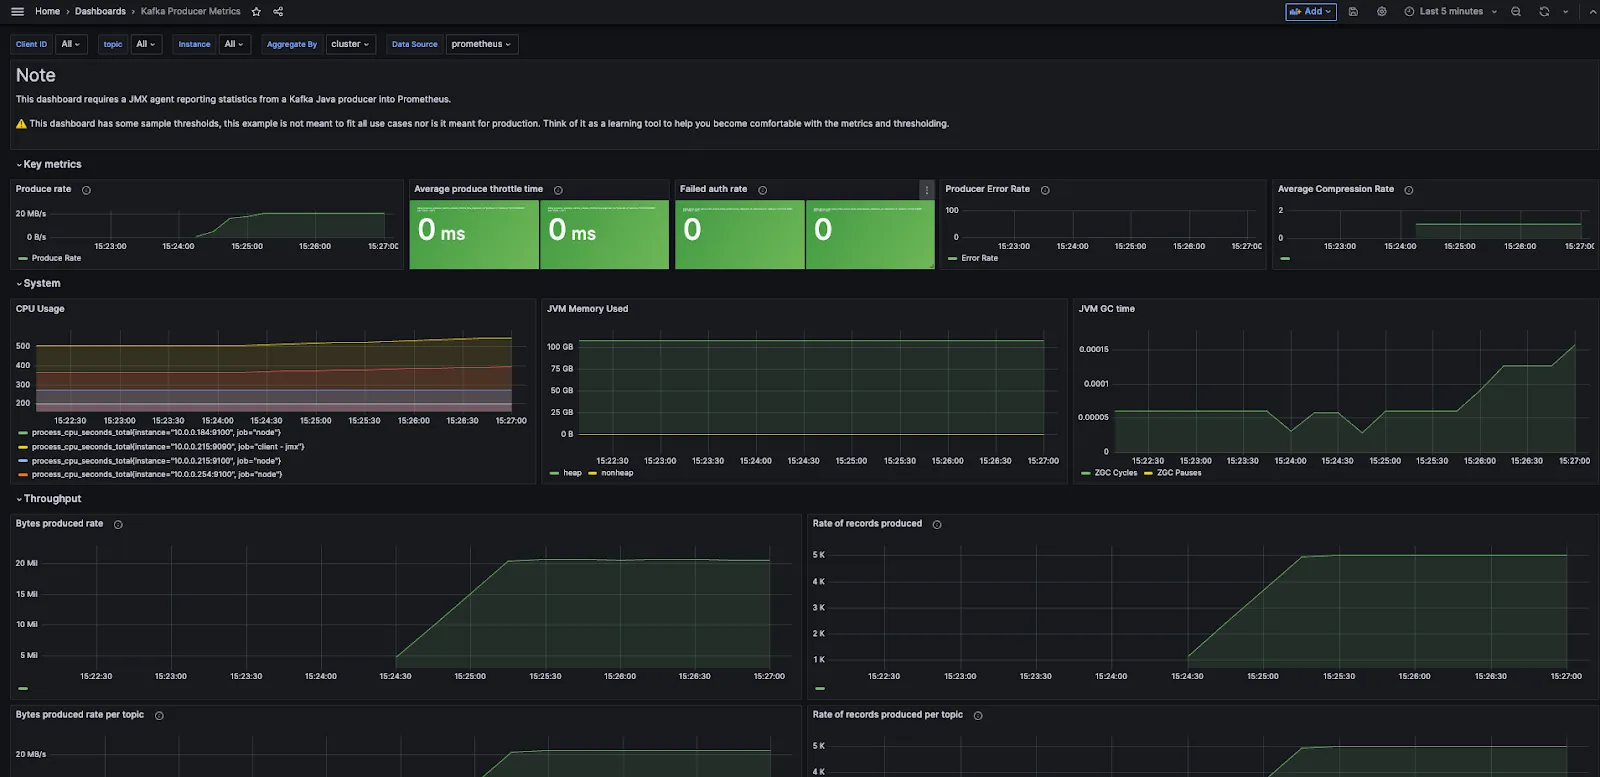
You can also build your own PromQL using the metrics exposed by Redpanda using Prometheus visualization UI, accessible at http://localhost:9090, or add panels to existing dashboards in Grafana. To see the list of all available public metrics in your system, query the /public_metrics endpoint using this CURL command:
curl http://localhost:9644/public_metricsWhen building applications that need real-time data streaming and processing, you’ll also need superior observability and monitoring capabilities. To keep things simple and streamline Day 2 operations, developers and data engineers everywhere choose Redpanda for its all-in-one architecture, developer-friendly tooling, and ready-to-use observability dashboards.
To learn more, check out Redpanda’s detailed documentation on monitoring:
Monitor Redpanda | Redpanda Self-Managed
Monitor Redpanda in Kubernetes
Monitor Redpanda Cloud
Subscribe to our VIP (very important panda) mailing list to pounce on the latest blogs, surprise announcements, and community events!
Opt out anytime.