
Bridge Queries in Redpanda SQL
Have your real-time cake and eat your analytics too
The simplest setup to process and analyze large-scale ad data in real time


Businesses running large-scale advertising campaigns need to analyze ad performance data as quickly as possible. Amazon Redshift, Amazon's fully managed petabyte-scale data warehouse, is a popular option as it enables the ingestion and processing of vast amounts of streaming ad event data in real time.
Redshift is a fast, scalable, and cost-effective solution for data warehousing, and its versatile architecture suits various data-intensive applications and excels in ad reporting for real-time insights.
Furthermore, it can be easily integrated with platforms like Apache Kafka® for streaming data analytics for instant analysis and real-time insights, which is crucial for advertisers.
The problem with Kafka is it’s notoriously complex to operate and stubborn to scale. That’s why more modern streaming data engines, like Redpanda, can help you take advantage of Redshift’s abilities while making your own job easier.
In this post, you'll learn how to integrate Redpanda with Amazon Redshift for simple and scalable data storage, reporting, and analytics.
Amazon Redshift is Amazon's answer to the growing demand for large-scale data processing and warehousing. It's a fully managed, cloud-based data warehouse service that's designed to handle large amounts of data and complex queries. Redshift allows organizations to run high-performance databases and query large data sets at a fast speed, making it especially useful for big data analytics.
Using Redshift, advertisers are able to track performance metrics such as impressions, clicks, and conversions. This way, they can gain insights into the campaign's effectiveness and the target audience's behavior. This immediate access to data allows for agile decision-making and enables advertisers to optimize their campaigns on the fly for better performance.
Additionally, Redshift can scale as advertising campaigns grow and data volumes increase. This ensures that performance remains consistent and reliable. This scalability is particularly beneficial for ad tech platforms that manage data from multiple sources and campaigns, as it allows them to maintain performance without the need for extensive infrastructure changes.
Imagine a retail company that runs online advertising campaigns across multiple platforms, including social media, search engines, and digital billboards. The company needs help understanding the effectiveness of its ad campaigns, so you plan to implement an ad analytics system with Redpanda and Amazon Redshift.
You'll first create a synthetic data set containing the advertising campaign data. This data includes metrics like impressions, clicks, user demographics, and conversion events. The next step will involve setting up Redpanda to ingest the ad data. Then, you'll configure Redpanda to feed this streaming data directly into Redshift using a JDBC sink connector. Within Redshift, the data can then be queried and analyzed.
The following diagram depicts the application's workflow:
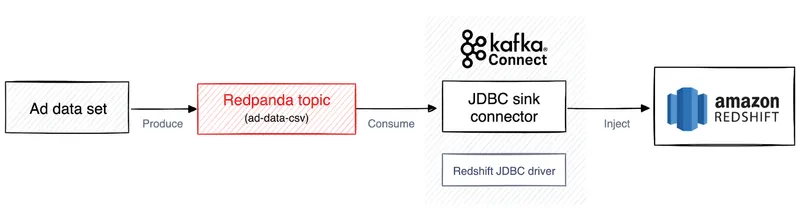
Architecture diagram of the application
To follow along, you'll need:
redpanda_redshift
├── configuration
├── pluginsIn this section, you'll generate a synthetic data set for the ad analytics use case. This involves generating CSV records that simulate ad event data. Create a file called generate_data.py in the redpanda_redshift directory and paste the code below into this file:
import csv
import random
import datetime

def generate_ad_event():
    platforms = ['Facebook', 'Google', 'Instagram', 'Twitter']
    event_types = ['impression', 'click']
    min_age = 18
    max_age = 80
    genders = ['Male', 'Female', 'Other']
    locations = ['New York', 'Los Angeles', 'Chicago', 'Houston', 'Miami', 'San Francisco']

    selected_event_type = random.choice(event_types)

    ad_event = {
        'timestamp': datetime.datetime.now().isoformat(),
        'ad_id': f"ad_{random.randint(1000, 9999)}",
        'platform': random.choice(platforms),
        'event_type': selected_event_type,
        'impressions': str(random.randint(1, 100) if selected_event_type == 'impression' else 0),
        'clicks': str(random.randint(1, 10) if selected_event_type == 'click' else 0),
        'age': str(random.randint(min_age, max_age)),
        'gender': str(random.choice(genders)),
        'location': random.choice(locations),
    }

    return ad_event

def generate_synthetic_dataset(num_records):
    return [generate_ad_event() for _ in range(num_records)]

# Generate 1000 synthetic ad events
synthetic_dataset = generate_synthetic_dataset(1000)

# Saving the dataset to a CSV file
with open('synthetic_ad_dataset.csv', 'w', newline='') as file:
    fieldnames = ['timestamp', 'ad_id', 'platform', 'event_type', 'impressions', 'clicks', 'age', 'gender', 'location']
    writer = csv.DictWriter(file, fieldnames=fieldnames)
    writer.writeheader()
    for event in synthetic_dataset:
        writer.writerow(event)

print("Synthetic dataset generated and saved as 'synthetic_ad_dataset.csv'")
This code generates a synthetic data set of advertising events and saves it as a CSV file called synthetic_ad_dataset.csv. Each event includes a timestamp, a unique ad ID, a platform, an event type (impression or click), the number of impressions and clicks, a numeric age, a gender, and a location.
To execute the script and generate the data, open a terminal in the redpanda_redshift directory and run the following command in your virtual environment that you created beforehand:
python generate_data.py
After the data set is generated, the first rows in the generated synthetic_ad_dataset.csv file should look similar to this:
timestamp,ad_id,platform,event_type,impressions,clicks,age,gender,location
2023-11-16T13:15:00.726783,ad_2303,Facebook,impression,91,0,28,Female,Chicago
2023-11-16T13:15:00.726801,ad_6147,Twitter,impression,92,0,60,Other,Los Angeles
2023-11-16T13:15:00.726809,ad_1632,Twitter,click,0,4,49,Male,MiamiOnce you've installed Docker and run the Redpanda container, you can validate it by executing the following command in the terminal:
docker psYou should see the following output:
CONTAINER ID   IMAGE                                                COMMAND                   CREATED          STATUS         PORTS			NAMES
03e564905746   docker.redpanda.com/redpandadata/redpanda:v23.2.14   "/entrypoint.sh redp…"    13 seconds ago   Up 9 seconds   0.0.0.0:19092->19092/tcp	redpanda-0
Next, you can validate the cluster by using the Redpanda rpk tool directly in the container. Run the following command in the terminal:
docker exec -it redpanda-0 \
    rpk cluster info
You should see the following output:
CLUSTER
=======
redpanda.7199aba6-f0d0-49bd-8ab0-6dac34ba858f

BROKERS
=======
ID    HOST        PORT
0*    redpanda-0  9092
You also need to create a Redpanda topic called ad-data-csv. Later, you'll produce the generated data set to this topic. To create the topic, execute the following command in the terminal inside the Docker container:
docker exec -it redpanda-0 rpk topic create ad-data-csv
Again, you can validate whether the topic was created by using the following command in the terminal:
docker exec -it redpanda-0 \
    rpk cluster info
The output states that the topic was successfully created:
CLUSTER
=======
redpanda.7199aba6-f0d0-49bd-8ab0-6dac34ba858f

BROKERS
=======
ID    HOST        PORT
0*    redpanda-0  9092

TOPICS
======
NAME                PARTITIONS  REPLICAS
ad-data-csv 1 1Next, you'll produce the data from the created data set synthetic_ad_dataset.csv to the Redpanda topic ad-data-csv. But first, you must install the Confluent Kafka-Python library (this tutorial uses version 2.2.0), which will provide the Consumer and Producer classes needed. You need to install the library in the Python virtual environment that you created beforehand. To install the library, open a terminal and execute the following command in your activated virtual environment:
pip install confluent-kafka
Following this, create a file called produce_data.py in the redpanda_redshift directory and paste the code below into the file:
import csv
import json
from confluent_kafka import Producer

# Kafka producer configuration
config = {
    'bootstrap.servers': 'localhost:19092',  # Update with your Redpanda server address
    'client.id': 'csv-producer'
}

producer = Producer(config)

topic_name = 'ad-data-csv'  # Update with your topic name

# Define your schema
schema = {
    "type": "struct",
    "fields": [
        {"field": "timestamp", "type": "string"},
        {"field": "ad_id", "type": "string"},
        {"field": "platform", "type": "string"},
        {"field": "event_type", "type": "string"},
        {"field": "impressions", "type": "string"},
        {"field": "clicks", "type": "string"},
        {"field": "age", "type": "string"},
        {"field": "gender", "type": "string"},
        {"field": "location", "type": "string"}
    ]
}
def produce_message(record):
    producer.poll(0)
    message = {
        "schema": schema,
        "payload": record
    }
    producer.produce(topic=topic_name, value=json.dumps(message))
    producer.flush()

def produce_from_csv(file_path):
    with open(file_path, newline='') as csvfile:
        reader = csv.DictReader(csvfile)
        for row in reader:
            produce_message(row)

csv_file_path = 'synthetic_ad_dataset.csv'  # Replace with your CSV file path
produce_from_csv(csv_file_path)
The Python script is designed to read the synthetic data from the CSV file and then publish it to the Redpanda topic ad-data-csv. This script first sets up a Kafka producer using the confluent_kafka client, configuring it with specific settings such as the Redpanda server address and a client ID.
The script then defines a schema for the data, which includes fields like timestamp, ad_id, platform, event_type, impressions, clicks, age, gender, and location, all of which are strings. This schema represents the structure of the data that will be published to the Redpanda topic.
The produce_message function is used to send individual records to the Kafka topic. It converts each record into a JSON format, incorporating the predefined schema, and then uses the Kafka producer to publish this message to the specified topic.
To run the script, open a terminal in the redpanda_redshift directory with your virtual environment activated and execute the following command:
python produce_data.py
The output in the terminal should look like this:
Produced to partition 0 at offset 0 with timestamp 1699893757538.
Produced to partition 0 at offset 1 with timestamp 1699893757538.
… output omitted …
Produced to partition 0 at offset 98 with timestamp 1699893757538.
Produced to partition 0 at offset 99 with timestamp 1699893757538.
To validate that the data was produced successfully to the topic, you can execute the following command in the terminal:
docker exec -it redpanda-0 rpk topic consume ad-data-csv --num 1
The output should show the first data entry that was produced to the topic. It should look something like this:
{
  "topic": "ad-data-csv",
  "value": "{\"schema\": {\"type\": \"struct\", \"fields\": [{\"field\": \"timestamp\", \"type\": \"string\"}, {\"field\": \"ad_id\", \"type\": \"string\"}, {\"field\": \"platform\", \"type\": \"string\"}, {\"field\": \"event_type\", \"type\": \"string\"}, {\"field\": \"impressions\", \"type\": \"string\"}, {\"field\": \"clicks\", \"type\": \"string\"}, {\"field\": \"age\", \"type\": \"string\"}, {\"field\": \"gender\", \"type\": \"string\"}, {\"field\": \"location\", \"type\": \"string\"}]}, \"payload\": {\"timestamp\": \"2023-11-16T13:10:57.264269\", \"ad_id\": \"ad_5478\", \"platform\": \"Google\", \"event_type\": \"impression\", \"impressions\": \"0\", \"clicks\": \"0\", \"age\": \"55\", \"gender\": \"Other\", \"location\": \"San Francisco\"}}",
  "timestamp": 1700136680254,
  "partition": 0,
  "offset": 0
}In the upcoming sections, you'll integrate Redpanda with Amazon Redshift to enable data transfer between them. The key to this process is using Kafka Connect, part of the Kafka ecosystem, which helps to link Kafka-compatible systems like Redpanda to various databases and cloud services.
This setup involves two primary steps: configuring Kafka Connect to work with Redpanda and implementing a sink connector for Amazon Redshift, specifically using the JDBC sink connector.
Kafka Connect enables connections between Redpanda and databases, search engines, and multiple cloud storage services. Kafka Connect operates by using source and sink connectors.
Source connectors import data into Kafka from external systems, whereas sink connectors export data from Kafka to other systems (such as Redshift in this scenario).
To set up Kafka Connect, download the Apache Kafka Connect package and store the binary in your redpanda_redshift directory.
Following this, you must configure Kafka Connect. Create a configuration file called connect.properties and save it in the directory redpanda_redshift/configuration. Paste the following configuration into the file:
# Kafka broker addresses
bootstrap.servers=localhost:19092

key.converter=org.apache.kafka.connect.json.JsonConverter
value.converter=org.apache.kafka.connect.json.JsonConverter
key.converter.schemas.enable=true
value.converter.schemas.enable=true

# Where to keep the Connect topic offset configurations
offset.storage.file.filename=/tmp/connect.offsets
offset.flush.interval.ms=10000

# Plugin path to put the connector binaries
plugin.path=../plugins/
Your redpanda_redshift directory should now reflect the following structure:
redpanda_redshift
├── configuration
│   ├── connect.properties
├── plugins
└── kafka_2.13-3.1.0Next, download the JDBC sink connector. Unzip the downloaded files into the redpanda_redshift/plugins/confluent-kafka-connect directory. Then, you must configure the sink connector to connect with Amazon Redshift.
Create a configuration file called redshift-sink-connector.properties and save the file in the directory redpanda_redshift/configuration. Paste the following configuration into the file:
name=redshift-sink-connector
connector.class=io.confluent.connect.jdbc.JdbcSinkConnector
tasks.max=1
topics=ad-data-csv

connection.url=<YOUR AMAZON REDSHIFT DATABASE URL>
connection.user=<YOUR AMAZON REDSHIFT USERNAME>
connection.password=<YOUR AMAZON REDSHIFT PASSWORD>
# Insert mode configurations
insert.mode=insert
Here, you have to add some inputs according to your unique project configuration:
name: The name that you want to call the JDBC sink connectortopics: The name of the Redpanda topic (in this tutorial, it's ad-data-csv)connection.url: The unique URL of your database that you obtain from the Redshift consoleconnection.user: Your unique database username that you obtain from the Redshift consoleconnection.password: The password that you have set for your Redshift clusterInjecting data from a Redpanda topic to Amazon Redshift using the JDBC sink connector requires the Redshift JDBC driver. The JDBC driver is essential for the JDBC sink connector in Kafka Connect, as it enables the connector to communicate with the database. It acts as a translator, converting Kafka Connect's (Java) calls into the database-specific operations required to insert, update, or query data.
You can download the driver directly from AWS. After the download, unzip the files into the directory redpanda_redshift/plugins/confluent-kafka-connect. Please note that the JDBC driver needs to be in the same directory as the JDBC sink connector.
Your redpanda_redshift directory should now reflect the following structure:
redpanda_redshift
├── configuration
│   ├── connect.properties
│   ├── redshift-sink-connector.properties
├── plugins
│   ├── confluent-kafka-connect
│        ├── [JDBC Sink Connector binaries]
│        ├── [JDBC driver binaries]
└── kafka_2.13-3.1.0To initiate the Kafka Connect connectors using the configurations you've applied, open a terminal on your system. Then, navigate to the redpanda_redshift/configuration directory. Within this directory, execute the command that starts the Kafka Connect cluster with your specified settings:
../kafka_2.13-3.6.0/bin/connect-standalone.sh connect.properties redshift-sink-connector.properties
This process will activate the connectors with the configurations set in the connect.properties and redshift-sink-connector.properties files, establishing the data pipeline between Redpanda and Amazon Redshift.
Once the connector is activated, it begins transferring all data from the Kafka topic ad-data-csv to a specified database within an Amazon Redshift cluster.
In this setting, every time new data is sent to the ad-data-csv topic, this new data is simultaneously uploaded to the Redshift cluster. Essentially, the connector ensures real-time synchronization of data between the Kafka topic and the Redshift database, maintaining an up-to-date copy of the data in the Redshift cluster as it's produced to the Kafka topic.
Now that you've successfully transferred data from your Redpanda topic to Amazon Redshift, you can start exploring it and extracting insights.
Using SQL queries, you can analyze various aspects of the ad data, ranging from the performance of different advertising platforms to demographic insights and the effectiveness of individual ads. To query the data, go to the query editor v2 in the Amazon Redshift console and type in SQL queries of interest into the editor.
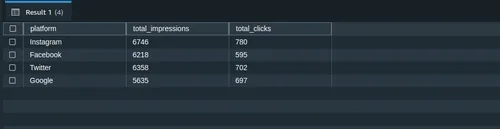
The following query will give you a summary of the total impressions and clicks for each advertising platform. This can be useful for understanding which platforms are most effective at generating impressions and clicks:
SELECT platform, SUM(impressions) AS total_impressions, SUM(clicks) AS total_clicks
FROM "dev"."public"."ad-data-csv"
GROUP BY platform;
The output looks as follows:
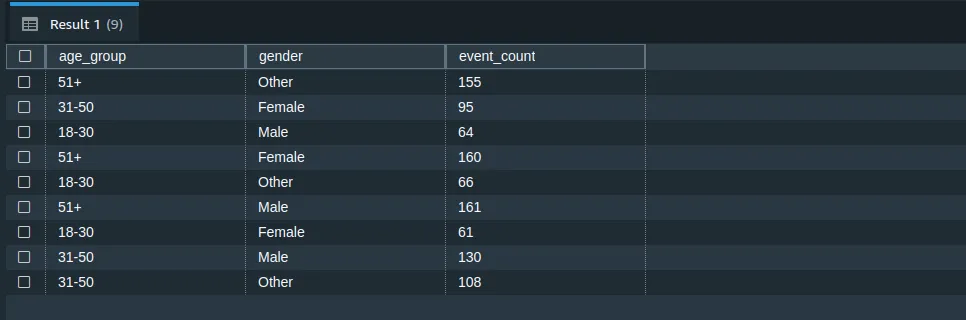
If you're interested in demographic analysis, the following query can provide you with a count of ad events (both impressions and clicks) categorized by age groups and gender (you can adjust the age groups as required):
SELECT
  CASE
    WHEN age BETWEEN 18 AND 30 THEN '18-30'
    WHEN age BETWEEN 31 AND 50 THEN '31-50'
    ELSE '51+'
  END AS age_group,
  gender,
  COUNT(*) AS event_count
FROM "dev"."public"."ad-data-csv"
GROUP BY age_group, gender;
The output looks as follows:
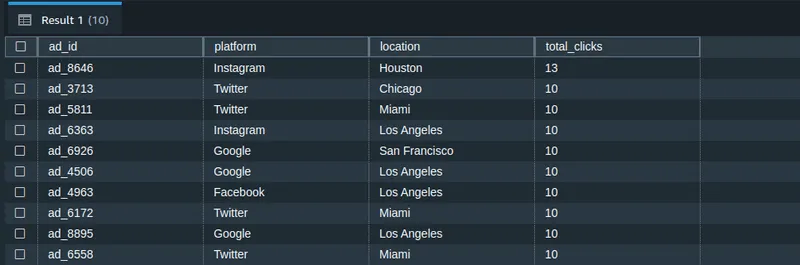
This query will help you identify which ads are getting the most clicks, which can be an indicator of their effectiveness:
SELECT ad_id, platform, location, SUM(clicks) AS total_clicks
FROM "dev"."public"."ad-data-csv"
WHERE event_type = 'click'
GROUP BY ad_id, platform, location
ORDER BY total_clicks DESC
LIMIT 10;
The output looks as follows:
Once the data pipeline between Amazon Redshift and Redpanda is established, you'll also need to optimize the query performance to achieve efficient data analysis. Here are some strategies:
EXPLAIN command in Redshift to understand how your queries are executed and identify bottlenecks.Furthermore, you also need to maintain data consistency across the entire pipeline. This can be achieved by following these steps:
Lastly, the following steps are recommended to handle varying ad volumes and maintain system performance:
Congrats! You learned how to deploy a scalable ad analytics system in the cloud using Redpanda and Amazon Redshift. In particular, you achieved this by integrating Redpanda, a Kafka-compatible event streaming platform, with Amazon Redshift, a cloud-based data warehouse. These technologies form an efficient combination for processing and analyzing large-scale ad data in real time.
For those interested in a deeper dive, the complete code from this tutorial is available in this GitHub repository, which contains all necessary scripts and configurations.
To continue exploring Redpanda and its capabilities, browse the Redpanda documentation. The Redpanda blog is also a great resource for tutorials and product updates. If you have any questions, chat with the Redpanda Community on Slack!
Subscribe to our VIP (very important panda) mailing list to pounce on the latest blogs, surprise announcements, and community events!
Opt out anytime.