

Using Apache Kafka for log aggregation


Apache Kafka® for log aggregation
Log aggregation involves collecting, centralizing, and analyzing logs from diverse systems, applications, and services to extract actionable insights. Effective log aggregation allows organizations to centralize log data from multiple sources to provide real-time visibility into system performance, security, and operational trends.
But as distributed systems and microservices become increasingly prevalent in the cloud-native era, monitoring and troubleshooting also grow ever more complex.
In this guide, you’ll learn how to use Apache Kafka for log aggregation and explore its benefits and real-world implementations. You’ll also see a technical example using Kafka as the data backbone and the Elasticsearch-Logstash-Kibana (ELK) stack for log aggregation.
Log aggregation with Apache Kafka and its benefits
Apache Kafka is a distributed event-streaming platform designed for creating high-throughput data pipelines. It’s particularly well-suited for log aggregation because it acts as scalable middleware between log producers and consumers. Logs from various sources—applications, servers, and databases—are ingested into Kafka topics, where they can be processed, stored, and analyzed in real time.
Log aggregation with Apache Kafka has several benefits:
- Real-time insights: Kafka enables real-time log ingestion and processing, allowing organizations to monitor systems as events occur.
- Simplified analysis: Aggregating logs from multiple systems into a single Kafka topic simplifies analysis and correlation.
- Centralized data collection: Kafka integrates with diverse log sources, creating a unified data pipeline for distributed systems and microservices.
- Improved troubleshooting: Centralized logs allow engineers to quickly identify and resolve issues by correlating events across systems.
- Analytics monitoring: The Kafka ecosystem enables monitoring of system performance and operational trends, enhancing visibility.
- Security: Kafka helps you monitor security events, identify anomalies, and detect breaches in real time.
- Scalability: Kafka scales to handle the massive log volumes generated by modern architectures.
- Compliance: Kafka provides long-term log storage options to aid in regulatory compliance.
- Data integration and ETL: Kafka topics serve as raw data repositories for downstream analytics and ETL workflows.
Real-world use cases of log aggregation with Apache Kafka
Apache Kafka is used for real-time log aggregation across a wide variety of industries. Some examples of companies that use Apache Kafka include Netflix, Slack, and Microsoft. It’s not only tech companies that rely on Apache Kafka for log aggregation; some healthcare systems also use it to meet regulatory obligations.
1. Netflix: Streaming infrastructure optimization
Netflix uses Kafka to aggregate logs from its streaming infrastructure. These logs are analyzed to ensure high availability, optimize performance, and troubleshoot issues in real time. By aggregating logs across multiple regions, Netflix can detect anomalies and proactively address potential service disruptions.
2. Slack: Microservices and database monitoring
Slack uses Kafka to aggregate logs from its microservices and databases, enabling quick identification and resolution of system issues. By centralizing logs, the Slack engineering team can correlate events across services and maintain high platform reliability.
3. Microsoft Azure: Cloud service monitoring
Azure uses Kafka for monitoring cloud service logs to meet SLA requirements. Kafka’s scalability and reliability ensure seamless log aggregation for cloud-based services. Azure’s Kafka use illustrates how large-scale cloud providers rely on robust log aggregation systems to deliver consistent performance.
4. Healthcare systems: Compliance and security
In the healthcare industry, organizations use Kafka to aggregate logs for compliance monitoring. By centralizing logs, these systems ensure their compliance with regulations like HIPAA while detecting potential security breaches. Kafka’s security features further enhance its suitability for sensitive data environments.
How to implement log aggregation with Apache Kafka
There are many approaches to implementing log aggregation with Apache Kafka. You basically need to integrate it with a system that can store logs, which can be a relational or non-relational database, a key-value store, or a simple search engine. You’ll need an integration tool that consumes messages from a particular Apache Kafka topic and produces them to your chosen storage. While you could use a generic integration tool like Apache Camel, Kafka-specific tools such as Kafka Connect or Redpanda Connect offer easier integration with Kafka.
You can also use more tailored tools for log aggregation, such as Logstash or Fluentd. Both tools are designed to collect logs from sources like Apache Kafka and store them in storage solutions such as Elasticsearch, which has an easy-to-integrate UI called Kibana. The Elasticsearch-Logstash-Kibana (ELK) and Elasticsearch-Fluentd-Kibana (EFK) stacks are commonly used in the tech industry.
The following sections explain how Apache Kafka and the ELK stack can be configured for log aggregation.
Kafka configuration overview
To implement log aggregation, Kafka must be configured to handle the expected volume of log data. Below is an example configuration file for a Kafka broker node (where the broker ID is 1):
broker.id=1
log.dirs=/tmp/kafka-logs
zookeeper.connect=ZK_HOST_NAME:2181
num.network.threads=3
num.io.threads=8
log.retention.hours=168
log.segment.bytes=1073741824
log.retention.check.interval.ms=300000

...other configs omitted...
In a production environment, it’s recommended to have at least three brokers to ensure a healthy quorum. The configuration for each broker may vary based on your specific needs.
In your local environment, you can run a Kafka cluster as follows:
bin/zookeeper-server-start.sh config/zookeeper.properties
bin/kafka-server-start.sh config/server.properties
In a production environment, it’s recommended to run your Kafka cluster as a service, such as by using systemd, rather than relying on a local setup. While this article doesn’t cover the details, you can refer to this guide and other similar resources available online.
Log data ingestion
To ingest log data from an application, you can send the logs to a Kafka topic whenever a log-related event occurs. To do this, create a producer application that ingests logs from various sources, such as applications, servers, or cloud services. Below is an example Python producer application using the confluent-kafka library:
from confluent_kafka import Producer
import socket
import a_function

conf = {'bootstrap.servers': 'localhost:9092',
        'client.id': socket.gethostname()}

producer = Producer(conf)

def delivery_report(err, msg):
    if err is not None:
        print(f'Message delivery failed: {err}')
    else:
        print(f'Message delivered to {msg.topic()} [{msg.partition()}]')

try:
  # An imaginary function that might cause an error here
  a_function()
except Exception as err:
  producer.produce('log_topic', key='key', value=f'{err}', callback=delivery_report)
  producer.flush()
This application uses a Kafka client to create a producer and produces the error message when the function a_function() returns an error.
Important: In this example, there is no data transformation; you directly send the error message to the Kafka topic log_topic for demonstration purposes. However, you can perform data transformations (such as parsing, filtering, and formatting logs) before the ingestion to standardize log formats and improve downstream processing.Data storage and management
As shown in the previous section, the producer sends messages to a Kafka topic, where the data is logically stored in a Kafka cluster. For more information about Kafka topics, you can check out the official documentation.
Logs are organized into Kafka topics based on criteria like application, service, or geographic region. Here’s an example that creates a Kafka topic called log_topic:
bin/kafka-topics.sh --create \
--topic log_topic \
--bootstrap-server BROKER1_HOST_NAME:9092 \
--partitions 3 \
--replication-factor 1
You can configure your Kafka cluster or your Kafka topic to define log retention policies to manage your storage more effectively. The log.retention.hours setting determines how long logs are retained, while log.cleanup.policy defines what happens after the retention period ends. Depending on your requirements, you can set the cleanup policy to either compact (default) or delete messages once the retention period expires.
Here’s an example that changes the topic’s log retention to 72 hours from the default 168 hours (1 week) and the cleanup policy to delete from the default compact:
log.retention.hours=72
log.cleanup.policy=delete
Log data consumption
For log data consumption, you can directly integrate a topic with an Elasticsearch index through Logstash.
The following Logstash configuration file consumes logs from the Kafka topic log_topic to write them in the Elasticsearch index log_index:
# logstash.conf
input {
  kafka {
    bootstrap_servers => "localhost:9092"
    topics => ["log_topic"]
  }
}
output {
  elasticsearch {
    hosts => ["localhost:9200"]
    index => "log_index"
  }
}
You can run Logstash with the above configuration to enable the flow of logs from Kafka to Elasticsearch:
logstash -f logstash.confLogstash connects Kafka and Elasticsearch, ensuring logs are parsed and stored for further analysis. It ensures that consumers scale with the volume of incoming logs.
Accessibility and usability
Once logs are ingested into Elasticsearch, you can search and analyze them using Elasticsearch’s powerful query language. Here are some basic example queries:
Search for logs from a specific application:
{
  "query": {
    "match": {
      "application": "app_name"
    }
  }
}
Filter logs by severity level:
{
  "query": {
    "term": {
      "severity": "error"
    }
  }
}
Retrieve logs within a specific time range:
{
"query": {
"range": {
"timestamp": {
"gte": "now-1h",
"lte": "now"
}
}
}
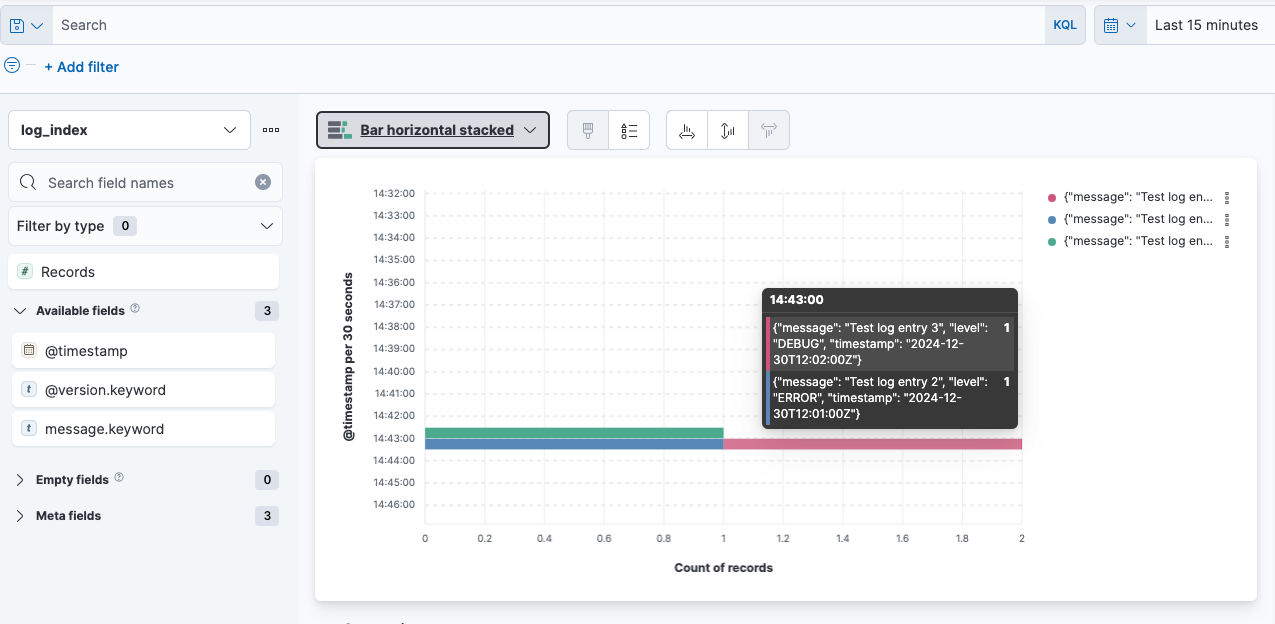
}Beyond these examples, Elasticsearch offers a broad range of querying and analysis capabilities for the stored log data. By configuring Kibana to access Elasticsearch data, you can create dashboards with pie charts, bar graphs, and line charts for visualizing log data in real time. The following example configuration enables Kibana to access Elasticsearch:
# kibana.yaml
server.port: 5601
elasticsearch.hosts: ["http://ES_HOST_NAME:9200"]
Once you connect Elasticsearch, you can run and open Kibana in your browser via http://KIBANA_HOST_NAME:5601 and start creating your dashboards. The following image demonstrates how Kibana can visualize log data consumed from Kafka and stored in Elasticsearch using Logstash:
Leverage real-time log aggregation with Redpanda
Log aggregation is essential for modern organizations, as it provides the foundation for monitoring, troubleshooting, and analyzing distributed systems. Apache Kafka’s scalability, reliability, and ecosystem of tools, along with its integrability, make it a powerful platform for building robust log aggregation pipelines.
However, managing traditional Kafka clusters can be complex. As a modern alternative to Kafka, Redpanda simplifies setup and operation while delivering superior performance and lower latency. With Redpanda’s log aggregation capabilities, organizations can achieve real-time insights without the operational overhead of traditional Kafka setups.
Whether you’re aggregating logs for a system like microservices, ensuring compliance, or enhancing security — Redpanda makes your job easier.