

Apache Kafka metrics


An overview of Kafka performance metrics
Apache Kafka® is one of the most popular tools for handling high-throughput, low-latency data transmission across a variety of applications. But as Kafka implementations grow and scale, maintaining data integrity, reducing lag, and meeting high availability demands can become challenging.
For DevOps engineers and developers managing Kafka clusters, Kafka performance metrics can provide insights into operational health, bottlenecks, and capacity needs and help address scaling challenges.
This chapter explores the most important Kafka performance metrics pertaining to clusters, brokers, topics, producers, and consumer group metrics. You’ll learn about the importance of these metrics in monitoring Kafka’s performance and how you can use them to optimize Kafka operations and effectively scale your clusters.
Exposing and visualizing Kafka performance metrics
Performance metrics in Kafka allow you to track throughput, detect issues, and optimize configurations. In general, Kafka metrics can be exposed by simply enabling JMX. Once JMX is enabled, you can access JMX MBeans and relevant metrics information.
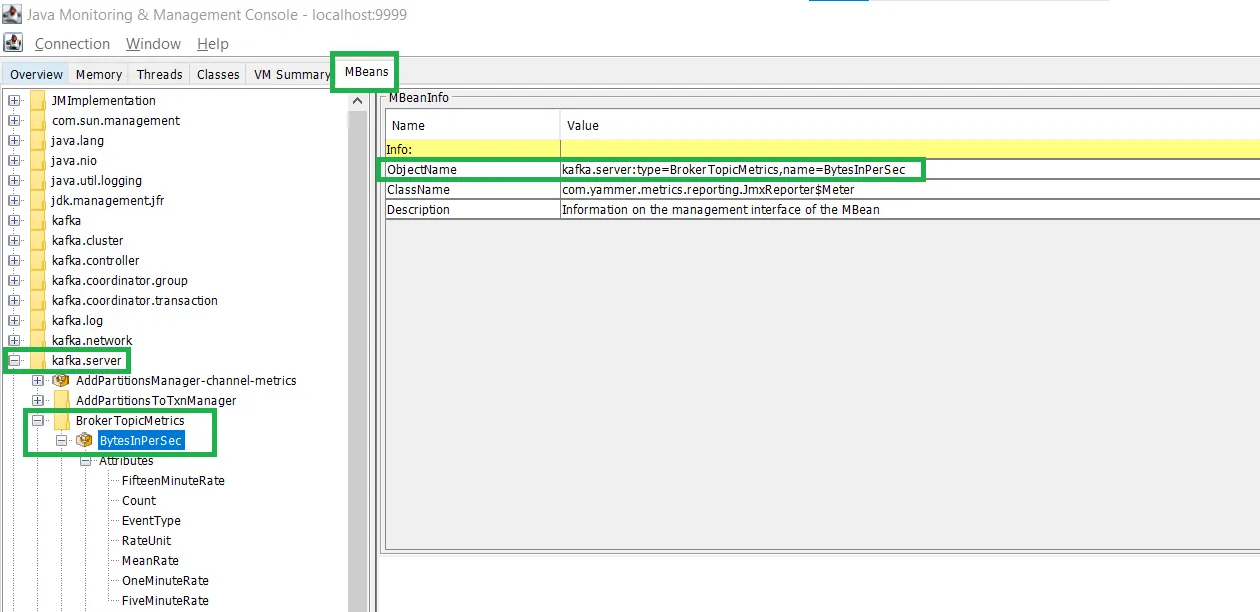
The JMX MBean object name kafka.server:type=BrokerTopicMetrics,name=BytesInPerSec specifies the hierarchical path used by monitoring tools to query that particular metric. It identifies the component (BrokerTopicMetrics) and the specific attribute (BytesInPerSec) within Kafka’s monitoring system.
Once the JMX metrics are exposed, they can be read using tools like JConsole and VisualVM. Other third-party monitoring tools like Prometheus and Grafana can also be integrated with JMX to visualize and alert on metrics.
The screenshot below shows the BytesInPerSec metric visualized in the JConsole UI. Similarly, you can access other metrics through this tool by navigating the ObjectName path specified for each metric in this article.
As mentioned, there are five primary categories of performance metrics you should monitor: cluster, broker, topic, producer, and consumer group. Let’s take a look at each in more detail.
1. Cluster metrics
Cluster metrics offer a comprehensive view of the overall health and performance of the Kafka environment. In this category, throughput and under-replicated partitions are the two most critical metric types to monitor.
Throughput metrics reveal how quickly data moves through the Kafka cluster, which helps engineers assess if their setup can manage the current load or if it requires scaling. High throughput suggests efficient data handling, while drops may indicate producer or consumer issues.
Key throughput metrics include:
- BytesInPerSec: This measures the rate of data production to the Kafka cluster, indicating incoming data throughput. The JMX MBean for this metric is
kafka.server:type=BrokerTopicMetrics,name=BytesInPerSec. - BytesOutPerSec: This measures the rate at which data is consumed from the Kafka cluster and reflects the outgoing data throughput. The JMX MBean for this metric is
kafka.server:type=BrokerTopicMetrics,name=BytesOutPerSec. - MessagesInPerSec: This tracks the number of messages Kafka received per second, which provides a message-level view of throughput. The JMX MBean for this metric is
kafka.server:type=BrokerTopicMetrics,name=MessagesInPerSec.
The under-replicated partitions metric identifies partitions with fewer replicas than expected, which risk data loss if a broker fails. Failure occurs when in-sync replicas fall below the replication factor, and healthy clusters minimize this metric to ensure redundancy. The JMX MBean for this metric is kafka.server:type=ReplicaManager,name=UnderReplicatedPartitions. A nonzero count indicates under-replicated partitions.
The screenshot below shows the navigation path of this metric in the JConsole UI:
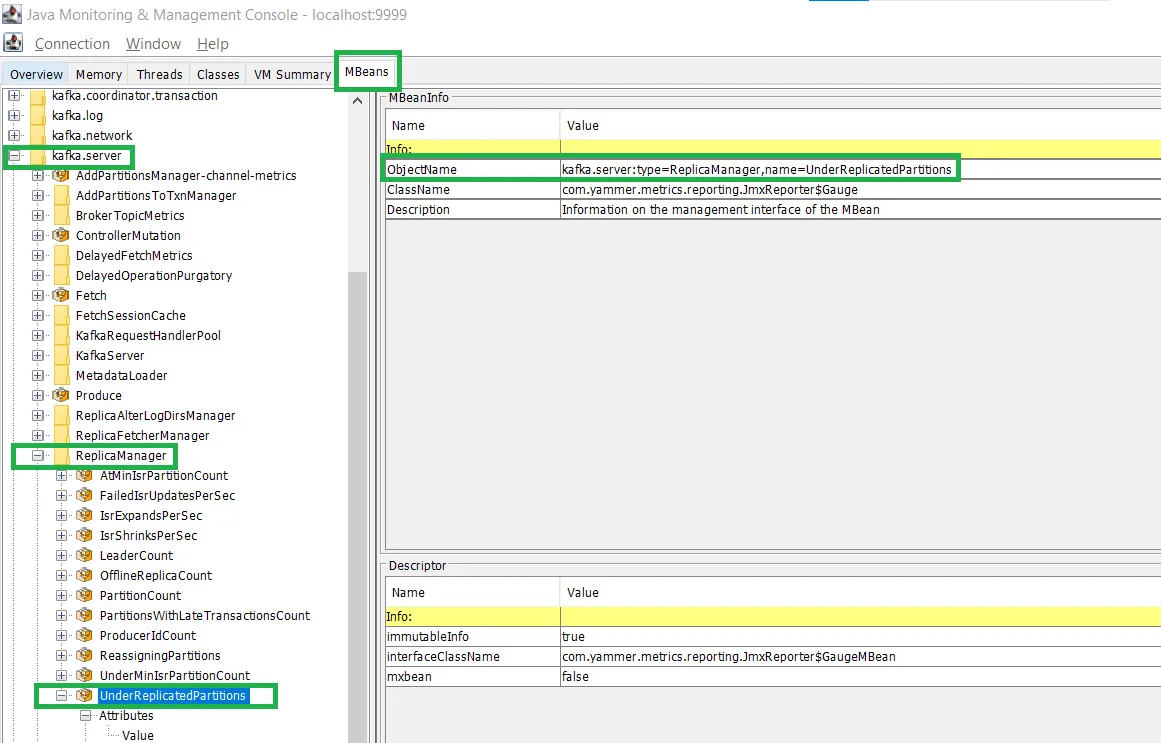
Monitoring these metrics not only gives engineers a clear view of the Kafka cluster’s health but also supports scaling strategies. When data throughput needs are consistently high, adding more brokers or increasing partition configurations can help manage increased loads without compromising performance.
2. Broker metrics
Kafka brokers form the backbone of Kafka clusters by managing data storage and replication and serving as intermediaries for message flow between producers and consumers. Broker health metrics provide insights into the stability, responsiveness, and resource utilization of each broker within the cluster. Key metrics include resource utilization and critical categories like under-replicated and offline partitions.
Resource utilization metrics like CPU, memory, disk I/O, network throughput, and request latency can identify issues such as bottlenecks, network congestion, or hardware problems. Setting threshold alerts enables proactive responses to prevent broker downtime. For example, sustained high CPU, memory, or disk usage may require autoscaling or redistributing partitions to reduce broker load and prevent downtime.
In addition to resource utilization, partition under-replication is another important broker metric to monitor. Under-replication happens when a broker can’t maintain replicas, which leads to data reliability risks. Using broker health metrics to address under-replication ensures all partitions remain fully replicated and accessible.
The following are the key metrics to monitor partition under-replication:
- Under-replicated partitions: Monitoring under-replication at the broker level helps identify specific brokers struggling to keep up with replication demands, which could indicate hardware limitations, network issues, or overloaded brokers. Please see the previous section for more details about this metric.
- Offline partitions count: This tracks the number of partitions unavailable for read or write operations. A nonzero count could mean data unavailability, which may also affect replication for those partitions. The JMX MBean for this metric is
kafka.controller:type=KafkaController,name=OfflinePartitionsCount.
If you want to avoid under-replicated partitions and minimize the risk of data loss, set up real-time alerts to detect these issues as they happen. If under-replication does occur, check metrics like network throughput, CPU usage, and memory usage to identify potential causes. For instance, if network I/O or CPU is high on a broker, it may struggle to keep replicas synchronized in a timely manner.
Proactively monitoring Kafka broker resource utilization and key metrics allows you to anticipate resource constraints and perform predictive maintenance, which also reduces the risk of downtime.
3. Topic metrics
Topic metrics provide visibility into how data is stored, distributed, and managed within Kafka topics. Effective monitoring of these metrics helps ensure that Kafka topics are optimized for both storage efficiency and performance. The following are some of the key metrics in this category:
- Log segment metrics: Log segments are smaller files within partitions that store messages. Tracking log segments helps to manage storage resources and ensure efficient data retrieval. For example, a Kafka topic handling many small messages may generate numerous small log segments, increasing memory usage and slowing log compaction or retention operations.
- Log retention and log compaction metrics: Log retention and compaction policies manage storage by removing old or redundant data. Retention controls how long messages are kept, and compaction removes duplicates. For example, in a real-time analytics application, a short retention policy might limit disk usage, keeping only the latest data. In contrast, longer retention is needed for scenarios requiring data availability over time. Compaction then helps reduce storage by retaining only the latest relevant data.
- Partition metrics: These are critical for understanding the distribution of data across Kafka brokers and play a pivotal role in achieving Kafka’s horizontal scalability. Increasing the number of partitions allows for improved parallelism and efficient resource utilization. Parallelism is improved because more partitions mean that more consumers in a consumer group can process data simultaneously. Efficient resource utilization is achieved by balanced data distribution, indicating an even workload distribution across brokers.
However, scaling partitions introduces some challenges:
- Under-replicated partitions: Adding too many partitions can strain broker resources, leading to replication lag.
- Load imbalances: If partitions are not evenly distributed, some brokers may become overloaded while others remain underutilized.
Partition metrics allow Kafka administrators to monitor load distribution by checking whether partitions are evenly spread across brokers, plan scaling efforts by determining if adjustments of partition counts or additional brokers are needed to handle changing data volumes, and identify brokers with under-replicated partitions that indicate potential performance issues. For example, if partition metrics show a large number of under-replicated partitions on certain brokers, this indicates a need to rebalance partition leaders or redistribute partitions across brokers to maintain system stability.
The following table summarizes the topic metrics along with their corresponding JMX MBeans:
Topic metrics provide visibility into your Kafka cluster’s performance and storage usage. These metrics can inform how you adjust configurations for optimal storage, ensure data availability, and respond proactively to prevent data loss or unavailability.
4. Producer metrics
Producer metrics provide insights into the efficiency and reliability of data production within Kafka. The following are the key producer metrics:
- Request latency: This is the time taken for a producer to send a message to Kafka and receive acknowledgement. High request latency could indicate network issues, high broker load, or producer-side issues that affect real-time data transfer efficiency.
- Throughput and error rates: Throughput measures the rate of data sent by producers, while error rates help identify issues that may cause message loss. Monitoring these metrics ensures that data production is consistent and that errors are minimized.
- Retries and backoff metrics: When a message fails to send, the producer retries after a set backoff period. Tracking retries and backoffs helps diagnose network or broker-side issues, allowing for more stable data production.
Request latency is one of the most important metrics for Kafka producers, particularly in environments that require real-time data processing and low latency. Kafka producer throughput is often limited by how quickly it can send data to brokers and receive acknowledgments. If request latency is high, each batch takes longer to acknowledge, reducing the speed at which new data can be sent. This delay constrains throughput, as the producer must wait for acknowledgments before sending additional batches (unless acks=0 is set, which could impact data reliability).
To optimize throughput, Kafka producers can use batching, or grouping records into larger batches to reduce request frequency and improve network efficiency. However, if the batches are too big, this may increase latency. Additionally, buffering and compression can reduce latency and increase throughput by sending multiple messages in a single request.
High request latency can also lead to increased error rates. For instance, if latency exceeds configured timeout thresholds (such as request.timeout.ms), Kafka producers may encounter TimeoutException errors, resulting in retries or failed message delivery. Frequent timeouts can trigger retries, which place additional load on brokers and may lead to duplicate messages unless idempotence is enabled. While retries ensure message delivery, excessive retries or failures due to latency can cause undesirable load and higher error rates.
This table summarizes the producer metrics along with their corresponding JMX MBeans:
By monitoring these producer metrics and keeping them in check, engineers can balance high throughput with low error rates, optimizing the speed and reliability of data ingestion into Kafka.
5. Consumer group metrics
Consumer group metrics focus on how effectively consumer groups are processing messages. These metrics help engineers ensure that consumer performance is aligned with the rate of message production. The following are some of the key consumer group metrics:
- Lag: This measures the delay between message production and its consumption by consumer groups. High lag can indicate that consumers are struggling to keep up with data production, which could result in latency-sensitive applications falling behind.
- Throughput and latency: These metrics monitor how quickly consumers are processing messages and the time taken from message arrival to processing. A balance between throughput and latency helps to maintain high consumer efficiency, especially when handling real-time applications.
- Rebalance metrics: Rebalancing refers to the reallocation of partitions within a consumer group. Rebalance metrics indicate how evenly distributed partitions are across consumers, which is vital for optimized message processing and fault tolerance as well as scalability.
Lag metrics can identify underperforming consumer instances, which you can then scale by adding more consumers to the group. You can also use these metrics to tune polling intervals and ensure that lag does not increase due to missed messages. In addition, replication lag is an important consideration, especially during data replication scenarios such as cluster migrations. Monitoring replication lag ensures that replicas remain in sync with the source and helps plan for a smooth migration by identifying bottlenecks in data transfer or processing delays. This dual focus on consumer and replication lag ensures both timely message consumption and data consistency across clusters.
Throughput and latency metrics provide insights for fine-tuning batch sizes to improve throughput without introducing significant latency. You can also use these metrics to assess whether you need to adjust consumer configurations or processing times. Reducing time-consuming tasks during message processing also minimizes consumer load, while tuning configuration values like fetch.min.bytes, fetch.max.wait.ms, and max.poll.interval.ms ensures efficient fetch size and processing intervals, avoiding bottlenecks.
Rebalance metrics help you ensure a balanced partition distribution across consumers. While rebalancing is necessary for fault tolerance and scalability, frequent rebalances can reduce efficiency as consumers must pause processing during updates. If rebalancing occurs too often, it could indicate stability issues or inefficient configuration. Monitoring these metrics helps identify and address potential problems, preventing consumer overloads and supporting consistent, high-efficiency message processing.
Here’s a summary of the consumer group metrics and their associated JMX MBeans:
These metrics are critical for monitoring and optimizing Kafka consumer group performance, especially regarding lag, throughput, and stability through rebalances.
Use cases for Kafka performance metrics
Kafka performance metrics are invaluable across various stages of development, deployment, and optimization, as they provide insights into Kafka’s health and usage patterns. Each metric highlights a unique aspect of Kafka’s performance, offering targeted solutions for maintaining a robust data pipeline. Here are some key use cases where Kafka performance metrics drive critical improvements.
Large-scale deployments
In large-scale deployments, Kafka performance metrics help to monitor and scale distributed Kafka clusters. Cluster and broker metrics, in particular, give engineers a clear view of how Kafka resources are utilized, allowing for better resource allocation and load balancing and ensuring a high degree of cluster uptime for meeting the needs of real-time data streaming.
Optimizing performance
Metrics enable engineers to fine-tune Kafka configurations, from optimizing consumer group lag to managing broker resource utilization and improving producer efficiency. Adjusting configurations based on throughput, latency, and error rates can significantly reduce the time data takes to travel from producers to consumers.
Scaling Kafka clusters
Kafka metrics can help companies plan effective scaling strategies. By monitoring cluster throughput and partition distribution, teams can allocate more resources or add brokers to handle higher loads. The ability to scale Kafka clusters smoothly helps maintain performance and availability as data demands grow.
Conclusion
This article explored the core metrics that DevOps engineers and developers can use to monitor and enhance Kafka performance. Tracking metrics across clusters, brokers, topics, producers, and consumer groups provides actionable insights that help to improve data flow, prevent data loss, and optimize resources for peak efficiency.
However, Kafka’s reliance on the Java Virtual Machine (JVM) introduces unique memory challenges, with garbage collection causing periodic pauses and creating a “wavy” memory pattern as usage alternates between peaks and drops during collection cycles. So, you need to monitor metrics like heap usage, garbage collection times, and memory pools to manage Kafka’s resource efficiency and avoid latencies or memory bottlenecks.
If you’re looking for a modern alternative to Kafka that isn’t built on JVM, Redpanda offers seamless data streaming without the complexities of traditional Kafka. Its compatibility with Kafka’s API ecosystem makes it easier to migrate. Redpanda also includes a predefined dashboard that streamlines observability setup. Its Seastar framework optimizes resource efficiency by running tasks on individual CPU cores and minimizing context switching.
While this core-pinning approach enhances performance, it can introduce unique CPU behavior that standard system-level monitoring tools might not fully capture. To ensure comprehensive insights into system health and performance, you can use Redpanda’s built-in monitoring tools and JMX-compatible metrics to enable fine-grained visibility and effective management of your streaming infrastructure.
To start streaming data in seconds with Redpanda, sign up for a free trial and try it for yourself! If you have questions, ask me in the Redpanda Community on Slack.