

Data engineering tools—an Overview


Data engineering tools
As data engineering redefines the possibilities of data usage, new and emerging trends are pivotal in shaping the future of tooling in the data ecosystem. Data engineering tools are the backbone of modern data infrastructure, empowering engineers to collect, process, and prepare data for analysis and turn raw information into actionable insights. Beyond data processing, the tools enhance data governance, discovery, and collaboration.
This article explores the world of data engineering tools. We look at tool categories and review some commonly used options.
Summary of data engineering tools
Data engineering tools can be classified into several distinct categories, each catering to specific aspects of the data pipeline. From data extraction and transformation to data storage and orchestration, these categories cover the entire spectrum of data engineering activities.
Whether you're looking to optimize data processing, ensure data quality, or streamline data integration, understanding these categories is critical to selecting the right tools for your data engineering needs. The rest of the article explores the sections outlined above in detail. The tool list mentioned in this article is not exhaustive and only covers the more popular ones.

Ingestion tools
Data Ingestion tools are gateways to your data pipeline, shaping how data enters your ecosystem. They facilitate the seamless collection of raw data from various sources, such as databases, logs, APIs, and streaming platforms. Data ingestion tools offer features like data deduplication, schema detection, and error handling to ensure data arrives reliably and consistently, making them a crucial first step in the data pipeline.
Redpanda
Redpanda is a simple, robust, highly scalable, and cost-efficient streaming data platform compatible with Apache Kafka® APIs while eliminating Kafka complexity. It was engineered from scratch and written in C++ as a data streaming tool with built-in schema registry, HTTP proxy, and message broker capabilities. Producers produce messages to topics, which can then be consumed by downstream tools or applications to process them.
Redpanda uses a patent-pending thread-per-core architecture to provide a high-throughput, low-latency, Kafka-compatible platform for ingesting streaming data into your pipelines. Its capabilities make it well-suited for real-time data ingestion and processing.
Kafka Connect
Kafka Connect is a tool that connects Kafka with external systems, such as databases, key-value stores, search indexes, and file systems, using software connectors. Connectors are ready-to-use components that import and export data from external systems to Kafka topics and vice versa.
The source connector collects data from an external system like databases, stream tables, or message brokers. It also collects metrics from application servers into Kafka topics, making stream processing data available at low latency. Source connectors offer an easy and declarative way for data ingestion.
A sink connector delivers data from Kafka topics into other systems, including indexes such as Elasticsearch, batch systems such as Hadoop, or any database.
Debezium
Debezium is an open-source platform for change data capture (CDC) built on top of Kafka. It is used to record row-level changes committed to a source database using transaction logs (like WAL in Postgres, Bin logs in Mysql, etc.).
Debezium provides a library of connectors, supporting multiple databases like MySQL, MongoDB, PostgreSQL, and others. Debezium deployment can be done in several ways but the most common method uses Kafka Connect. You use a configuration file to create a source Kafka connector that reads insert, update and delete changes from a database and publishes them to Kafka.
Let’s take a look at a sample config:
{
  "name": "mysql-connector",
  "config": {
    "connector.class": "io.debezium.connector.mysql.MySqlConnector",
    "tasks.max": "1",
    "database.hostname": "localhost",
    "database.port": "3306",
    "database.user": "<username>",
    "database.password": "<password>",
    "database.server.id": "184054",
    "database.server.name": "test-app-connector",
    "database.whitelist": "core_db",  // Replace with your db name
    "table.whitelist": "orders",   // Replace with your table name
    "database.history.kafka.bootstrap.servers": "localhost:9092",
    "database.history.kafka.topic": "orders-cdc"
  }
}We can start Kafka connect with this config and changes from the orders table will start getting published to Kafka topic.
./bin/connect-standalone.sh config/connect-standalone.properties mysql-connector-config.jsonYou can also use Debezium with Redpanda. The entire Kafka Connect ecosystem works out of the box with Redpanda, as Redpanda is API-compatible with Apache Kafka®.
[CTA_MODULE]
Transformation tools
Once data is ingested, it needs to be cleansed, validated and transformed to meet the specific needs of your downstream applications. Transformation tools enable you to perform these tasks efficiently and accurately, helping you to optimize your data pipeline and ensure the quality of your data.
Some of the more common data transformation tools are given below.
Apache Spark™
Spark is a unified analytics engine that can be used for both batch and streaming data processing. It is built on the Hadoop Distributed File System (HDFS) and uses a distributed architecture to process data quickly and efficiently. It can scale horizontally to handle large datasets across multiple nodes. You can also cache data in memory, significantly improving the performance of data processing operations.
Spark has a high fault tolerance so that data processing continues even if some nodes in the cluster fail. It can read and write data to various data systems, including HDFS, Hive, Cassandra, and Amazon S3, and also supports multiple programming languages like Java, Scala, Python, and R.
Apache Airflow™
Airflow is a workflow management platform that you can use to orchestrate complex data pipelines. It is built on top of Python and provides a simple and intuitive way to define and manage workflows. Airflow uses a distributed architecture with the following components:
- The web server provides a user interface for managing Airflow workflows.
- The scheduler is responsible for scheduling and executing Airflow tasks.
- The workers provide compute that is responsible for actually running Airflow tasks.
- The metadata database stores information about Airflow workflows, tasks, and dependencies.

Airflow workflows are defined using directed acyclic graphs (DAGs), a mathematical structure that makes it easy to visualize and manage complex workflows. It can dynamically schedule tasks based on the availability of resources and dependencies. This ensures that workflows run efficiently and tasks do not start until all their dependencies have been met.
Airflow provides monitoring and alerting features like task status, workflows, and resources. It also includes the ability to send alerts when tasks fail or when workflows are delayed. It is extensible, and you can integrate it with other tools and services. For example, it has operators for Snowflake and Tableau, so you can carry out operations like running queries or refreshing dashboards as a part of Airflow tasks.
dbt
Data build tool (dbt) is a command-line tool that allows data analysts and engineers to transform data in their warehouse using SQL. It facilitates ELT, so engineers can store data as is and transform it just before it is used. Companies can write transformations and orchestrate them more efficiently. It doesn’t offer extraction or load operations and only acts as a transformation layer of the data engineering stack.
Let’s look at a sample dbt model and configuration file.
-- models/sample_dbt_model.sql
-- Define a DBT model
with customer_revenue as (
    select
        customer_id,
        sum(billing_amount) as total_revenue
    from
        base_data.orders
    group by
        customer_id
)

select
    cr.customer_id,
    cr.total_revenue
from
customer_revenue crConfiguration file can be used to create connections to the data source (for example here we are connecting to Snowflake)
# profiles.yml

my_dbt_profile:
  target: dev
  outputs:
    dev:
      type: snowflake
      account: testaccount.snowflakecomputing.com
      user: test
      password: <password_here>
      role: DATA_ENGINEER
      warehouse: DATA_ENGG
      database: core
      schema: customer
Apache Flink®
Apache Flink® is an open-source stream processing framework designed for high-throughput, low-latency processing of data streams. It supports event time processing, stateful computation, exactly-once processing guarantees, and unifies batch and stream processing. Flink is often used for real-time analytics, event-driven applications, and data processing tasks that require low-latency and high-throughput processing. We look at Flink in more detail in a later chapter where we explore data streaming technologies.
Kafka Streams
Kafka Streams (a.k.a Kstreams) is a library in the Apache Kafka® ecosystem that enables real-time stream processing of data. It allows developers to build applications that can read, process, and write data to and from Kafka topics in a distributed and fault-tolerant manner. Kafka Streams provides abstractions for stream processing operations, making it easy to create scalable, stateful, and event-driven applications for tasks like data enrichment, transformation, and aggregation directly within the Kafka ecosystem.
Let’s look at how we can build a basic fraud detection streaming application using Kstreams:
import org.apache.kafka.streams.KafkaStreams;
import org.apache.kafka.streams.StreamsBuilder;
import org.apache.kafka.streams.StreamsConfig;
import org.apache.kafka.streams.kstream.Consumed;
import org.apache.kafka.streams.kstream.KStream;
import org.apache.kafka.streams.kstream.Produced;
import org.apache.kafka.streams.kstream.TimeWindows;

import java.util.Properties;
import java.util.concurrent.TimeUnit;

public class FraudDetectionStreamApp {

    public static void main(String[] args) {
        Properties config = new Properties();
        config.put(StreamsConfig.APPLICATION_ID_CONFIG, "fraud-detection-app");
        config.put(StreamsConfig.BOOTSTRAP_SERVERS_CONFIG, "localhost:9092");
        config.put(StreamsConfig.DEFAULT_KEY_SERDE_CLASS_CONFIG, Serdes.String().getClass().getName());
        config.put(StreamsConfig.DEFAULT_VALUE_SERDE_CLASS_CONFIG, Serdes.String().getClass().getName());

        StreamsBuilder builder = new StreamsBuilder();

        KStream<String, PaymentTransaction> paymentTransactions = builder.stream("payment-transactions", Consumed.with(Serdes.String(), customSerdeForPaymentTransaction()));

        KStream<String, FraudulentTransaction> fraudulentTransactions = paymentTransactions
            .groupByKey()
            .windowedBy(TimeWindows.of(TimeUnit.MINUTES.toMillis(5)))
            .aggregate(
                () -> new TransactionStats(0, 0),
                (key, transaction, stats) -> stats.update(transaction.getAmount()),
                Materialized.with(Serdes.String(), customSerdeForTransactionStats()))
            .filter((key, stats) -> isFraudulent(stats))
            .mapValues((key, stats) -> createFraudulentTransaction(key, stats))
            .toStream()
            .to("fraudulent-transactions", Produced.with(Serdes.String(), customSerdeForFraudulentTransaction()));

        KafkaStreams streams = new KafkaStreams(builder.build(), config);
        streams.start();

        Runtime.getRuntime().addShutdownHook(new Thread(streams::close));
    }
}
The processing logic involves calculating transaction statistics over a time window and identifying potentially fraudulent transactions based on predefined criteria. Detected fraudulent transactions are sent to a "fraudulent-transactions" topic for further action.
[CTA_MODULE]
Storage tools
Once your data has been transformed, it needs to be stored in a way that is efficient, scalable, and accessible. The data that needs to be stored can be structured, semi-structured, or even unstructured.
- Unstructured data has no predefined format or structure, like photos, video and audio files, text files, and social media content.
- Structured data has a well-defined format and can be stored in tabular format like demographic information, customer data, or accounting transactions.
- Semi-structured data has some structure but is not as rigidly structured as structured data.
Structured data is the easiest to search and organize. Semi-structured data is often stored in XML, JSON, and YAML formats. Unstructured data is the most difficult to process and analyze because it does not conform to a specific schema. You can store it in a file or object storage.
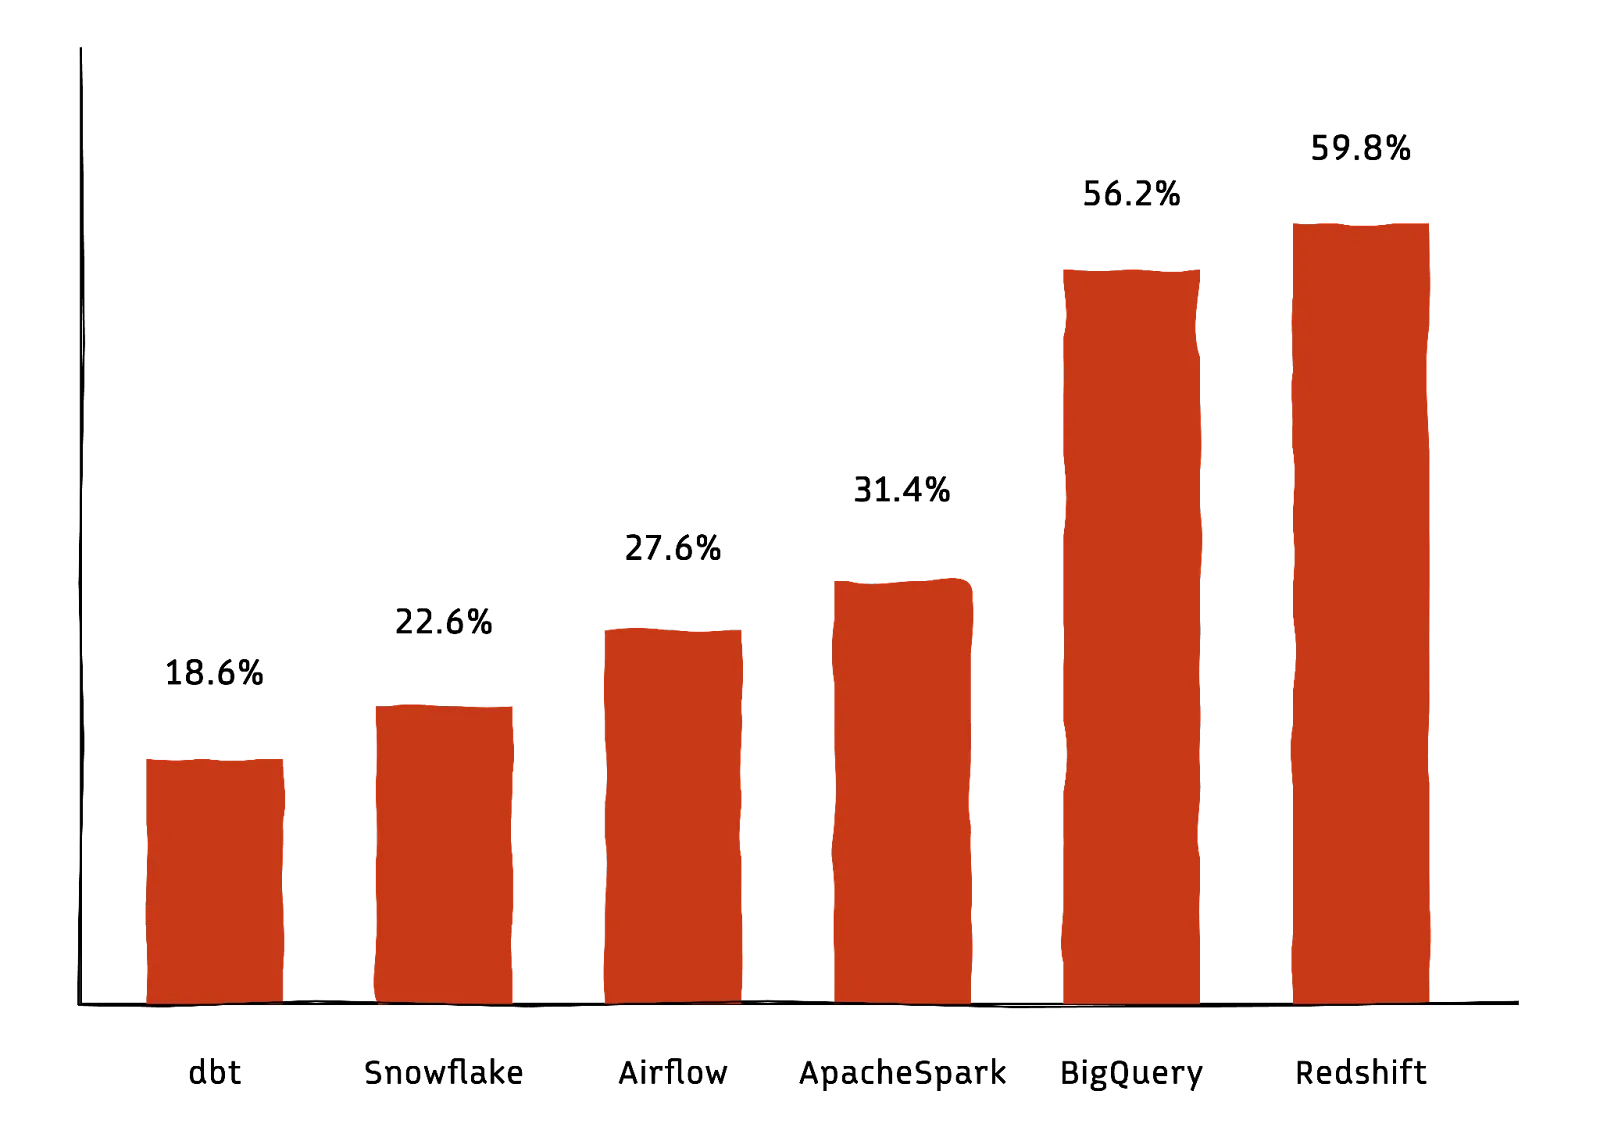
Data storage tools provide you with various options for storing your data, depending on your specific needs. The below graph shows 2023 trends in data tool adoption (Source: Secoda).
Data lakes
Data lakes are repositories for storing large amounts of semi-structured and unstructured data. Popular cloud-based data lakes include Amazon S3, Azure Data Lake Storage, and Google Cloud Storage.
Amazon S3 is currently the most popular data lake. It manages data with an object storage architecture that aims to provide high availability, scalability, and low latency with 99.99% reliability. Objects are the basic storage unit of Amazon S3, and you can organize objects into buckets. A unique, user-assigned key identifies each object. S3 can be used to store any type of data cost-effectively.
Data warehouses
Data warehouses are central repositories for storing and analyzing large amounts of structured data. Amazon Redshift is currently leading as a fully managed data warehousing service by AWS. It uses columnar storage, parallel processing, and automatic query optimization to deliver fast query performance on large datasets. You only pay for the compute and storage resources you use, making it a cost-effective solution for data analytics. Other top data warehousing solutions include:
BigQuery
BigQuery can be used to store and analyze structured, semi-structured, and unstructured data. It is a cloud-based data warehouse that is designed to be scalable, reliable, and easy to use. It can query billions of rows in seconds.
Snowflake
Snowflake is another cloud-based, fully-managed enterprise data warehouse that separates computing from storage. All data is stored in a single, centralized location, and compute resources are scaled independently of storage. This makes Snowflake more cost-effective than other data warehouses, and you can process queries very quickly, even on large datasets.
Snowflake also uses virtual warehouses that isolate compute resources dedicated to a specific user or workload. They are elastic and can be increased or decreased in size (ranging from X-Small to 6X-Large warehouses) as per requirements. Isolation helps to ensure that workloads do not interfere with each other and consequently improves performance.
Data lakehouses
The data lakehouse is an emerging concept in enterprise big data storage architectures. It is an evolution of the data warehouse and data lake architectures and is meant to combine the best aspects of each. It combines the data lake features of low-cost storage in an open, accessible format with powerful management and optimization features from the warehouse.
Delta Lake
Delta Lake is an open-source storage framework that enables building a Lakehouse architecture with compute engines like Spark, Flink, and more. It supports ACID transactions, scalable metadata, unified streaming, and batch data processing over a data lake storage layer. You can use it with any query engine on any cloud using APIs in Scala, Java, Rust, and Python.
Apache Hudi
Hudi is a popular open-source lakehouse that enables you to build an end-to-end data pipeline on top of existing data lakes. Hudi provides:
- Transactional guarantees for your data lake tables, meaning that you can be sure that your data is always consistent.
- ACID semantics so your data is always available, consistent, isolated, and durable.
- Upserts so you can update or insert data into your data lake tables without having to rewrite the entire table.
Monitoring tools
Data monitoring tools help you keep track of the health and performance of your data pipeline. They can alert you to problems such as data quality issues, performance bottlenecks, and outages. You can quickly and proactively resolve these issues, ensuring that your data pipeline is always running smoothly. We’ll now talk about Grafana, the most popular monitoring tool at the time of writing.
Grafana
Grafana is an open-source monitoring and observability platform that enables you to visualize, query, understand, and set alerts on your metrics, irrespective of where they’re stored. Grafana allows you to:
- Create and share interactive dashboards that visualize metrics from various data sources, including Prometheus, Graphite, InfluxDb, and more.
- Send alerts via email, Slack, PagerDuty, and other notification channels when metrics exceed or fall below certain thresholds.
- Automatically detect anomalies in your metrics and notify you when they occur.
- Trace the flow of requests through your distributed system and identify performance bottlenecks.
It also has a large and active community of plugin developers, which means that there are plugins available for a wide variety of data sources and visualizations.
Data quality and governance tools
Data governance is the process of managing data in a way that ensures data is accurate, consistent, trustworthy, and always meets the security and regulatory requirements of your organization. It includes establishing and enforcing policies and procedures for data collection, storage, use, and disposal, irrespective of data volume or complexity.
Data quality and governance tools streamline policy enforcement and enhance visibility. A data quality tool that has been garnering interest over the last few years is Great Expectations.
Great Expectations
Great Expectations (GX) is an open-source data quality tool that helps teams build a shared understanding of their data through quality testing, documentation, and profiling. It is a Python-based tool that allows data teams to profile, test, and create data reports.
- Automatically profile data and identify potential quality issues.
- Create and run data tests to validate the quality of your data.
- Generate documentation for your data quality tests.
- Generate reports on the results of your data quality checks.
The reports help you track the quality of your data over time and identify trends in data quality. The tool also features a user-friendly command-line interface (CLI), making setting up new tests and customizing existing reports easy.
Reporting tools
Once your data has been ingested, transformed, stored, and monitored, you need to be able to report on it to gain insights. Reporting tools help you to create and share reports and dashboards with stakeholders so that they can make informed decisions based on the data. Some of the popular reporting tools include Tableau, Streamlit, and Kibana.
Tableau
Tableau is a powerful data visualization and business intelligence tool that allows users to connect to various data sources, transform and analyze data, and create interactive, shareable visualizations and dashboards. It has the following components:
- Workbooks are files created in Tableau Desktop that contain worksheets and dashboards where data is visualized and analyzed.
- Dashboards are interactive, user-friendly displays combining multiple visualizations and worksheets into one view.
- Tableau Prep is used for data preparation and employs data flows.
- Flows in Tableau Prep enable you to clean, reshape, and transform data before analysis.
Tableau also allows you to connect to various data sources, including databases, spreadsheets, and web services. You can extract and transform data from these sources into a format suitable for visualization and analysis.
Streamlit
Streamlit is a modern-day low-code data visualization tool that helps users build powerful data apps and dashboards. It is an open-source Python library that makes it easy to create and share beautiful, custom web apps for machine learning and data science.
import streamlit as st
import pandas as pd
import cufflinks as cf
from sklearn.datasets import load_wine

wine = load_wine()
wine_df = pd.DataFrame(data=wine.data, columns=wine.feature_names)
wine_df["WineType"] = [wine.target_names[t] for t in wine.target ]
scatter_fig = wine_df.iplot(kind="scatter", x="alcohol", y="malic_acid",
                    mode="markers",
                    categories="WineType",
                    asFigure=True, opacity=1.0,
                    xTitle="Alcohol", yTitle="Malic Acid",
                    title="Alcohol vs Malic Acid",
                    )

scatter_fig
This example code produces a web app with the following plot:
streamlit run streamlit_dashboard.py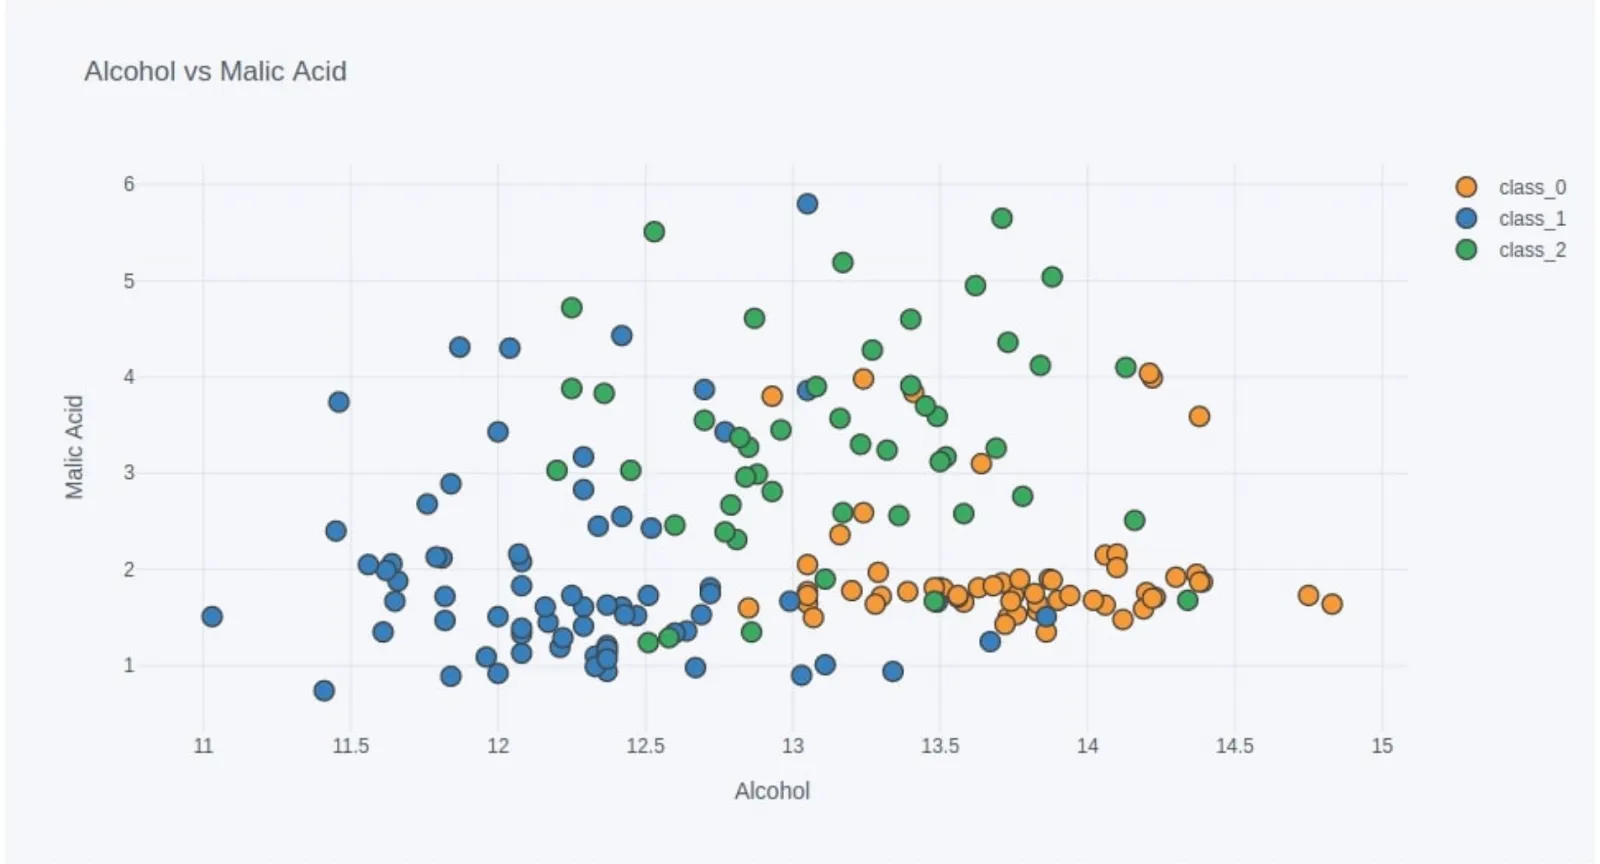
Kibana
Kibana is the visualization layer of the Elastic stack (ELK stack - Elasticsearch Logstash Kibana). It is often thought to be similar to Grafana, but in reality, these are two very different tools. While Grafana is a platform for visualizing and analyzing time series data, while Kibana is a tool for searching, analyzing, and visualizing data stored in Elasticsearch.
Kibana allows users to create real-time dashboards and perform interactive searches on data stored in Elasticsearch. It is commonly used for log and event data analysis, providing a user-friendly interface to search, filter, and visualize log data, making it easy to identify trends and issues. As mentioned, Kibana tightly integrates with Elasticsearch, leveraging its powerful search capabilities and serving as a vital component of the Elastic Stack for data analysis and visualization.
[CTA_MODULE]
Conclusion
In data engineering, the toolbox is as crucial as the data itself. Data engineering tools have emerged as the essential enablers of data-driven decision-making. They form the backbone of the data pipeline, from ingestion and transformation to storage, orchestration, and analytics.
Data catalogs, with their centralized repositories of metadata, are fostering a culture of data transparency and accountability. They enable users to discover, understand, and effectively utilize data assets, ensuring quality and compliance. At the same time, data platforms are evolving to offer end-to-end solutions, simplifying data management and analytics. These platforms unify data engineering components and provide streamlined workflows, scalability, and interoperability across cloud and on-premises environments.
Data engineering tools empower organizations to harness the full potential of their data assets while achieving greater agility and cost-efficiency. Organizations can extract actionable insights, optimize operations, and gain a competitive edge by efficiently collecting, processing, and managing data from many sources.
[CTA_MODULE]