Kafka Burrow partition lag—Measure and reduce
Kafka Burrow partition lag
Apache Kafka® is a popular distributed streaming platform that allows users to publish and subscribe to streams of records in real time. Many companies use it for data streaming, message queuing, and real-time data processing. Kafka operates across multiple nodes, making identifying and diagnosing issues difficult. Monitoring provides visibility into the health and performance of the underlying Kafka infrastructure.
This article explores a widely used Kafka monitoring tool: Burrow. First, we look into what Burrow is and how to set it up and use it. Then, we deep dive into the Kafka Burrow partition lag metric and explore ways to monitor it and resolve issues.
What is Kafka Burrow?
Kafka Burrow is an open-source Kafka monitoring tool created by LinkedIn to help users monitor their Kafka clusters. It simplifies the complicated monitoring process by providing real-time metrics of Kafka topics, partitions, and consumer groups and alerting admin users when certain metric thresholds are reached. Burrow can monitor multiple Kafka clusters, and you can configure it to support a wide range of alerting options, including email, Slack, PagerDuty, and others. You can also integrate it with other monitoring tools like Prometheus and Grafana.
The table below highlights a few key features and advantages contributing to its popularity.
| Feature | Description |
|---|---|
| Consumer group management | Provides a centralized view of all consumer groups in the Kafka cluster, along with their current status, lag, and partition assignments. |
| Lag monitoring | Enables you to monitor partition lag across your Kafka cluster |
| Alerting | Provides flexible and customizable alerting capabilities that allow you to receive notifications when certain events or conditions occur. |
| REST API | Provides a RESTful API that allows you to programmatically access Kafka cluster information, consumer group data, and lag metrics. |
| Multi-topic and multi-partition support | Allows you to monitor consumer groups across multiple topics and partitions. |
| Real-time metrics | Provides real-time metrics for monitoring the performance of the Kafka cluster, consumer groups, and partitions. |
| Historical data retention | Stores historical data to allow for trend analysis and capacity planning. |
Setting up Kafka Burrow
We give two approaches to setting up Burrow using code samples and screenshots below.
Using Docker Compose to set up Kafka Burrow
You can build and run the Docker container as a daemon from the Burrow project folder.
The above command uses the Docker Compose file to install Apache ZooKeeper™, Kafka, and Burrow. Some test topics also get created by default.
Building a binary using Go to set up Kafka Burrow
As Burrow is written in Go, you must first install and set up Go on your system to run Go commands and build a binary. After that, you can proceed as below.
Install Burrow
The first step is to install Burrow on your system. You can download the latest version of Burrow from the official GitHub repository.
Configure Burrow
You can configure Burrow using a YAML file that specifies the Kafka cluster to be monitored and various settings related to monitoring and alerting. An example burrow.yml configuration file monitors a Kafka cluster running on localhost.
Build and run the binary
Finally, you need to build the binary and run it.
[CTA_MODULE]
Using Kafka Burrow
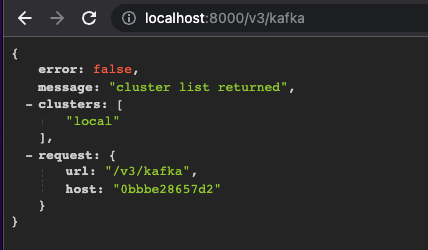
Once Burrow is set up, you can verify that it is running on your system by checking the URL http://localhost:8000/v3/kafka. You should see something like the screenshot below.

Once everything is working, you need to pull data from Burrow. There are two ways you can interact with Burrow.
API endpoints
Burrow exposes several API endpoints you can access to get a JSON response with information about the Kafka clusters that Burrow is monitoring. You can find the entire set of endpoints in the Burrow wiki on GitHub. Here's a summary of the key endpoints:
| Request | Method | API Endpoint |
|---|---|---|
| Health check | GET | /burrow/admin |
| List clusters | GET | /v3/kafka |
| Kafka cluster detail | GET | /v3/kafka/{cluster} |
| List consumers | GET | /v3/kafka/{cluster}/consumer |
| List cluster topics | GET | /v3/kafka/{cluster}/topic |
| Get consumer detail | GET | /v3/kafka/{cluster}/consumer/{group} |
| Get topic detail | GET | /v3/kafka/{cluster}/topic/{topic} |
| Consumer group status | GET | /v3/kafka/{cluster}/consumer/{group}/status, /v3/kafka/{cluster}/consumer/{group}/lag |

Dashboard UI
Although the official Burrow project does not feature a Dashboard, there are some open source projects built for this. BurrowUI is one such front-end UI project. You can install it as below.
BurrowUI should now be live on your local host at port 80.
What is Kafka Burrow Partition Lag?
In Kafka, partition lag refers to the difference between the current offset of a partition and the offset of the last produced message in that partition. It represents the number of messages in that partition that any consumer has not yet consumed.
It is important to note that partition lag should not be confused with consumer lag, another popular Kafka metric. The term consumer lag refers to the difference between the offset of the last produced message in a partition and the offset of the last consumed message in that partition by a specific consumer or a consumer group.
In short, consumer lag measures the progress of a consumer or a consumer group in consuming and processing messages. In contrast, partition lag measures the backlog of messages in a partition. While consumer lag causes partition lag, it is not the only cause of partition lag. You can have partition lag due to other reasons as well.
Both partition lag and consumer lag are essential metrics for monitoring the health and performance of Kafka consumer groups. You can use them in conjunction to identify and troubleshoot issues. Burrow source code exposes the “kafka_burrow_partition_lag” variable, which you can use to track partition lag in three ways.
[CTA_MODULE]
HTTP API Endpoint to monitor Kafka Burrow partition lag
You can use one of two API endpoints to get partition lag-related information
- /v3/kafka/{cluster}/consumer/{group}/status
- /v3/kafka/{cluster}/consumer/{group}/lag
You can integrate these APIs into your own Kafka monitoring application or use Burrow Exporter module to export metrics to Prometheus and monitor them in a tool like Grafana.
The endpoint "/status" returns an object that only includes the partitions in a bad state (like a WARN, ERR or STOP state where the partition is not behaving ideally). The endpoint "/lag" returns an object that includes all partitions for the consumer, regardless of the evaluated state of the partition. A sample response is shown below.
API response status
The API calls return a status, a short string describing the status of either the group or partition. Some responses you can expect:
- NOTFOUND - The group is not found for this cluster.
- OK - The group or partition is in a good state. There is no considerable lag and offsets are also moving along nicely.
- WARN - The group or partition is in a warning state. For example, the offsets are moving, but the lag is increasing.
- ERR - The group is in an error state. For example, the offsets have stopped for one or more partitions, but the lag is non-zero.
- STOP - The partition has stopped. For example, the offsets have not been committed for a long period.
- STALL - The partition has stalled. For example, the offsets are being committed but not changing, and the lag is non-zero.
Dashboard UI to monitor Kafka Burrow partition lag
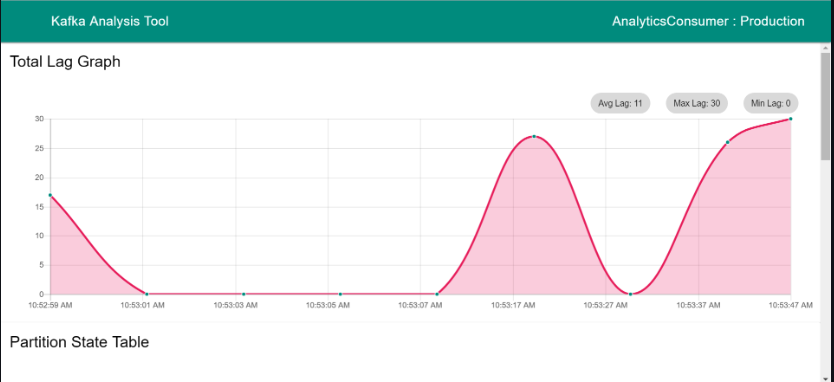
Once you have deployed and configured Burrow UI, you can access the Burrow web interface to view the health and performance of your Kafka cluster. To monitor partition lag specifically, navigate to the Partition Lag tab. Here you can view the partition lag details for each topic and partition the consumer group consumes.
The Burrow web interface displays:
- A summary of the lag for each consumer group
- The lag for individual partitions
It displays the partition lag in terms of the number of messages behind the latest offset. Here are some example screenshots:


What causes Kafka Burrow partition lag?
If Burrow detects partition lag, it is essential to identify and address the root cause of the issue. Here are some likely causes of partition lag that you can investigate.
Producer errors
A partition lag may arise if the producer suddenly sends more data than the consumers expect. You can check logs of existing producer applications for anomalies or use Kafka's built-in tools like kafka-console-producer or kafka-producer-perf-test to send messages to Kafka and monitor their throughput.
Consumer errors
A partition lag may arise if the consumer’s consumption has slowed (consumer lag). You can use Burrow or other monitoring tools to check the consumer group lag and identify any lagging consumers. If the consumers are lagging, you may need to investigate the consumer's configuration or look for network issues that could be preventing the consumers from consuming data.
Configuration errors
A partition lag could also be due to configuration issues with Kafka. You may need to review Kafka's configuration settings, including the number of partitions, replication factor, and broker settings, to ensure that they are optimal for your workload. For example, you may need to check if the right partitioner is used while producing messages (partitioner.class config) to avoid skewed distribution of events across partitions.
Network problems
Network issues can also cause partition lag in Kafka. You may need to check for network congestion or network outages that slow data transfer between Kafka brokers and consumers.
Disk I/O problems
If Kafka brokers are experiencing high disk I/O, it could also lead to partition lag. You may need to check the broker's disk usage and monitor disk I/O performance to identify any disk-related issues.
[CTA_MODULE]
Conclusion
Kafka Burrow is a powerful open-source tool that provides monitoring and management capabilities for Kafka. It allows developers and operations teams to monitor and manage consumer groups in real time, ensuring optimal performance and efficient resource utilization.
One of the key metrics to monitor is partition lag. You can use API endpoints and Dashboard UI to read Kafka Burrow partition lag metrics and troubleshoot errors by investigating various system aspects.
[CTA_MODULE]


