

Kafka performance tuning—Strategies and practical tips


Kafka performance tuning
It's not enough to just use Apache Kafka®. You also need to configure key parameters correctly to realize its full potential. Fortunately, you can achieve optimal performance and scalability through proper tuning and usage.
This article discusses the importance of performance tuning and provides tips and best practices for optimizing your Kafka cluster. We cover various aspects of performance tuning, including producers, consumers, brokers, cluster sizing, operating system optimization, hardware optimization, and monitoring.
By the end of this article, you will better understand how to fine-tune your Kafka implementation for maximum performance and scalability. Let’s get started.
Key Kafka performance metrics
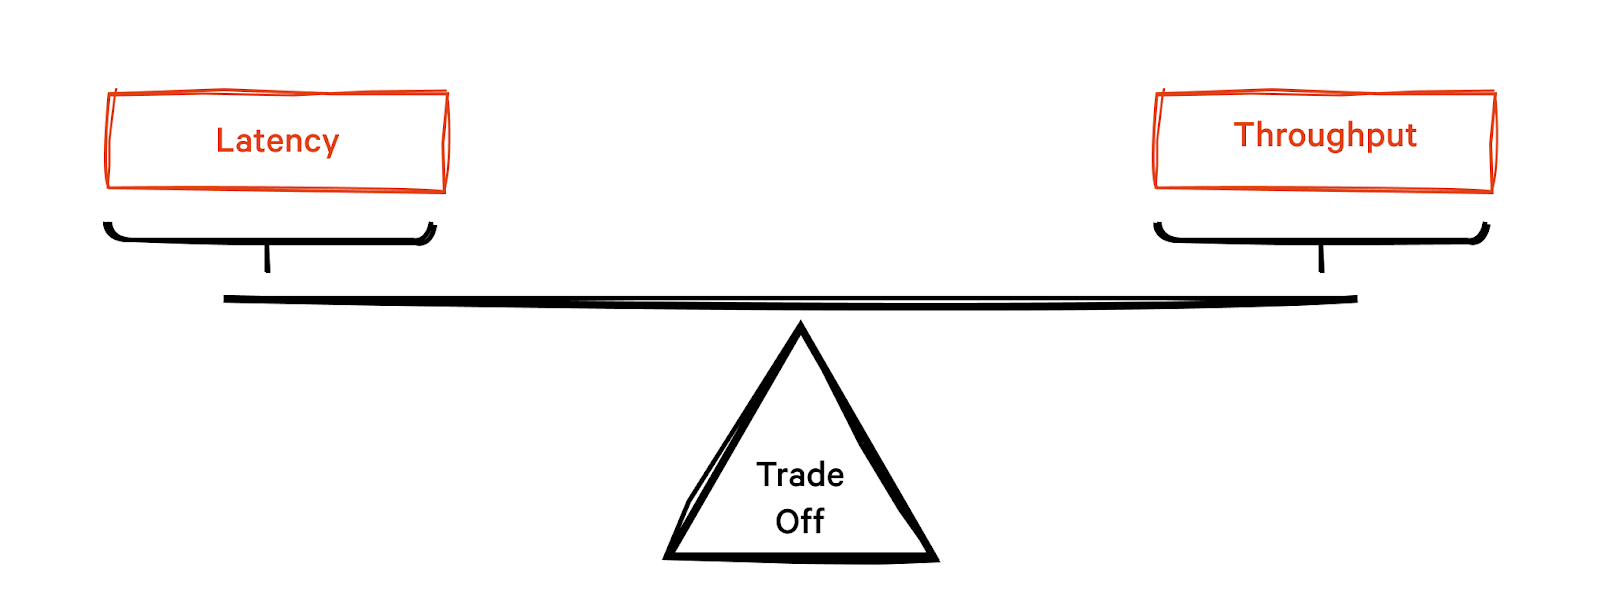
You can measure Kafka's performance with two primary metrics: latency and throughput. Both metrics are essential to consider when tuning your Kafka implementation. You must balance minimizing latency and maximizing throughput to achieve optimal performance.
Latency
Latency measures how long it takes to fetch or pull a single message. It is the time gap between the producer generating a message and the customer consuming it. Low latency is critical for real-time applications, where delays in data processing have significant consequences.
To reduce latency, you optimize your configuration to minimize the time it takes for Kafka to process a single event. You can consider strategies like:
- Tuning the number of partitions and replication factors
- Optimizing the hardware and network configurations
- Using compression to reduce the size of the data that Kafka processes.
Throughput
Throughput measures how many messages Kafka can process in a given period. High throughput is essential for applications that process large amounts of data quickly. To maximize throughput, you optimize your Kafka configuration to handle as many events as possible within a given time frame. Strategies include:
- Increasing the batch size
- Increasing the number of producer threads
- Increasing the number of partitions
You can also consider using hardware that is optimized for high throughput, such as high-speed drives and high-performance network adapters.
Summary of Kafka performance tuning strategies
The table below summarizes the various Kafka performance tuning strategies we cover in the rest of this article.
Kafka performance tuning of brokers
Brokers are the backbone of a Kafka cluster, responsible for storing and managing message data. A Kafka broker lets customers fetch messages by topic, partition, and offset. When creating Kafka topics, balancing the partition count and replication factor is essential. A higher partition count enables more parallelism and allows for greater throughput. However, it also creates additional overheads, increasing broker workload and eventually affecting broker performance. Similarly, a higher replication factor increases data availability and durability but may also increase disk usage and network traffic. Finding the right balance between these factors is crucial for optimizing broker performance.
For Kafka performance tuning, you can adjust broker topic configurations such as segment size, retention settings, and cleanup policies.
[CTA_MODULE]
Segment size
Segments are the basic units in which Kafka brokers store log files. They split each partition into multiple segments and write messages to these segments in an append-only manner.
log.segment.bytes
This configuration defines the size of a single log segment in bytes. A larger segment size means the Kafka broker creates fewer segments, reducing the required file descriptors and handles. However, a larger segment may also increase the time to clean up old messages, leading to increased disk usage. Choose a segment size that balances the trade-off between resource usage and cleanup efficiency.
Retention
Retention settings control how long Kafka brokers retain messages in a topic before they are eligible for deletion. You can configure retention based on time or size.
log.retention.hours
This setting controls the retention period of messages in hours. The default value is 168 hours (7 days). You can adjust this value based on your data retention requirements. Reducing the retention time frees up disk space but may lead to data loss if customers do not process messages promptly.
log.retention.bytes
This setting controls the maximum size of the log for a partition before the broker deletes old messages. This setting is not enabled by default, and retention is only based on time. Enabling size-based retention limits the growth of your Kafka logs in situations where disk space management strategies are favored.
Cleanup policies
Cleanup policies determine how Kafka deletes old messages from the log. Kafka's log.cleanup.policy configuration can be tailored to address specific data retention and storage management requirements. By setting this policy to either compact or delete, you can optimize the handling of your Kafka logs to better suit your use cases.
log.cleanup.policy = compact
When the log.cleanup.policy is set to compact, Kafka performs log compaction, which retains only the most recent message for each unique key within a partition. This approach is particularly useful in situations where you need to maintain the latest state of each key, such as when tracking the current status of user profiles, inventory levels, or sensor readings. Log compaction ensures that the most relevant data is kept while older, redundant messages are removed, thereby optimizing storage usage.
log.cleanup.policy = delete
On the other hand, if the log.cleanup.policy is set to delete, Kafka removes messages based on their age. This deletion policy relies on the log.retention.hours, log.retention.minutes, or log.retention.ms configurations to determine the message retention period. Once a message surpasses the specified age, it is deleted from the log. This policy is ideal for situations where only recent data is required, such as time-sensitive analytics, monitoring systems, or data streams with a limited relevance window. By using the log deletion policy, you can effectively manage storage consumption while ensuring that outdated data is removed from the system.
Log compaction improves performance by reducing the amount of data that needs to be read by consumers, especially for topics with a high volume of updates. However, it also increases the time for Kafka to clean up old messages, as it needs to scan the entire log for duplicate keys. Choose a cleanup policy that best fits your use case and data access patterns.
Kafka performance tuning of producers
Kafka producers are responsible for sending messages to the Kafka cluster. Optimizing their performance is essential for achieving high throughput and low latency. This section discusses key configurations and strategies to fine-tune Kafka producers.
Batch size
Batching multiple messages together before sending them to the Kafka broker significantly improves throughput by reducing the overhead of network communication and I/O operations.
batch.size
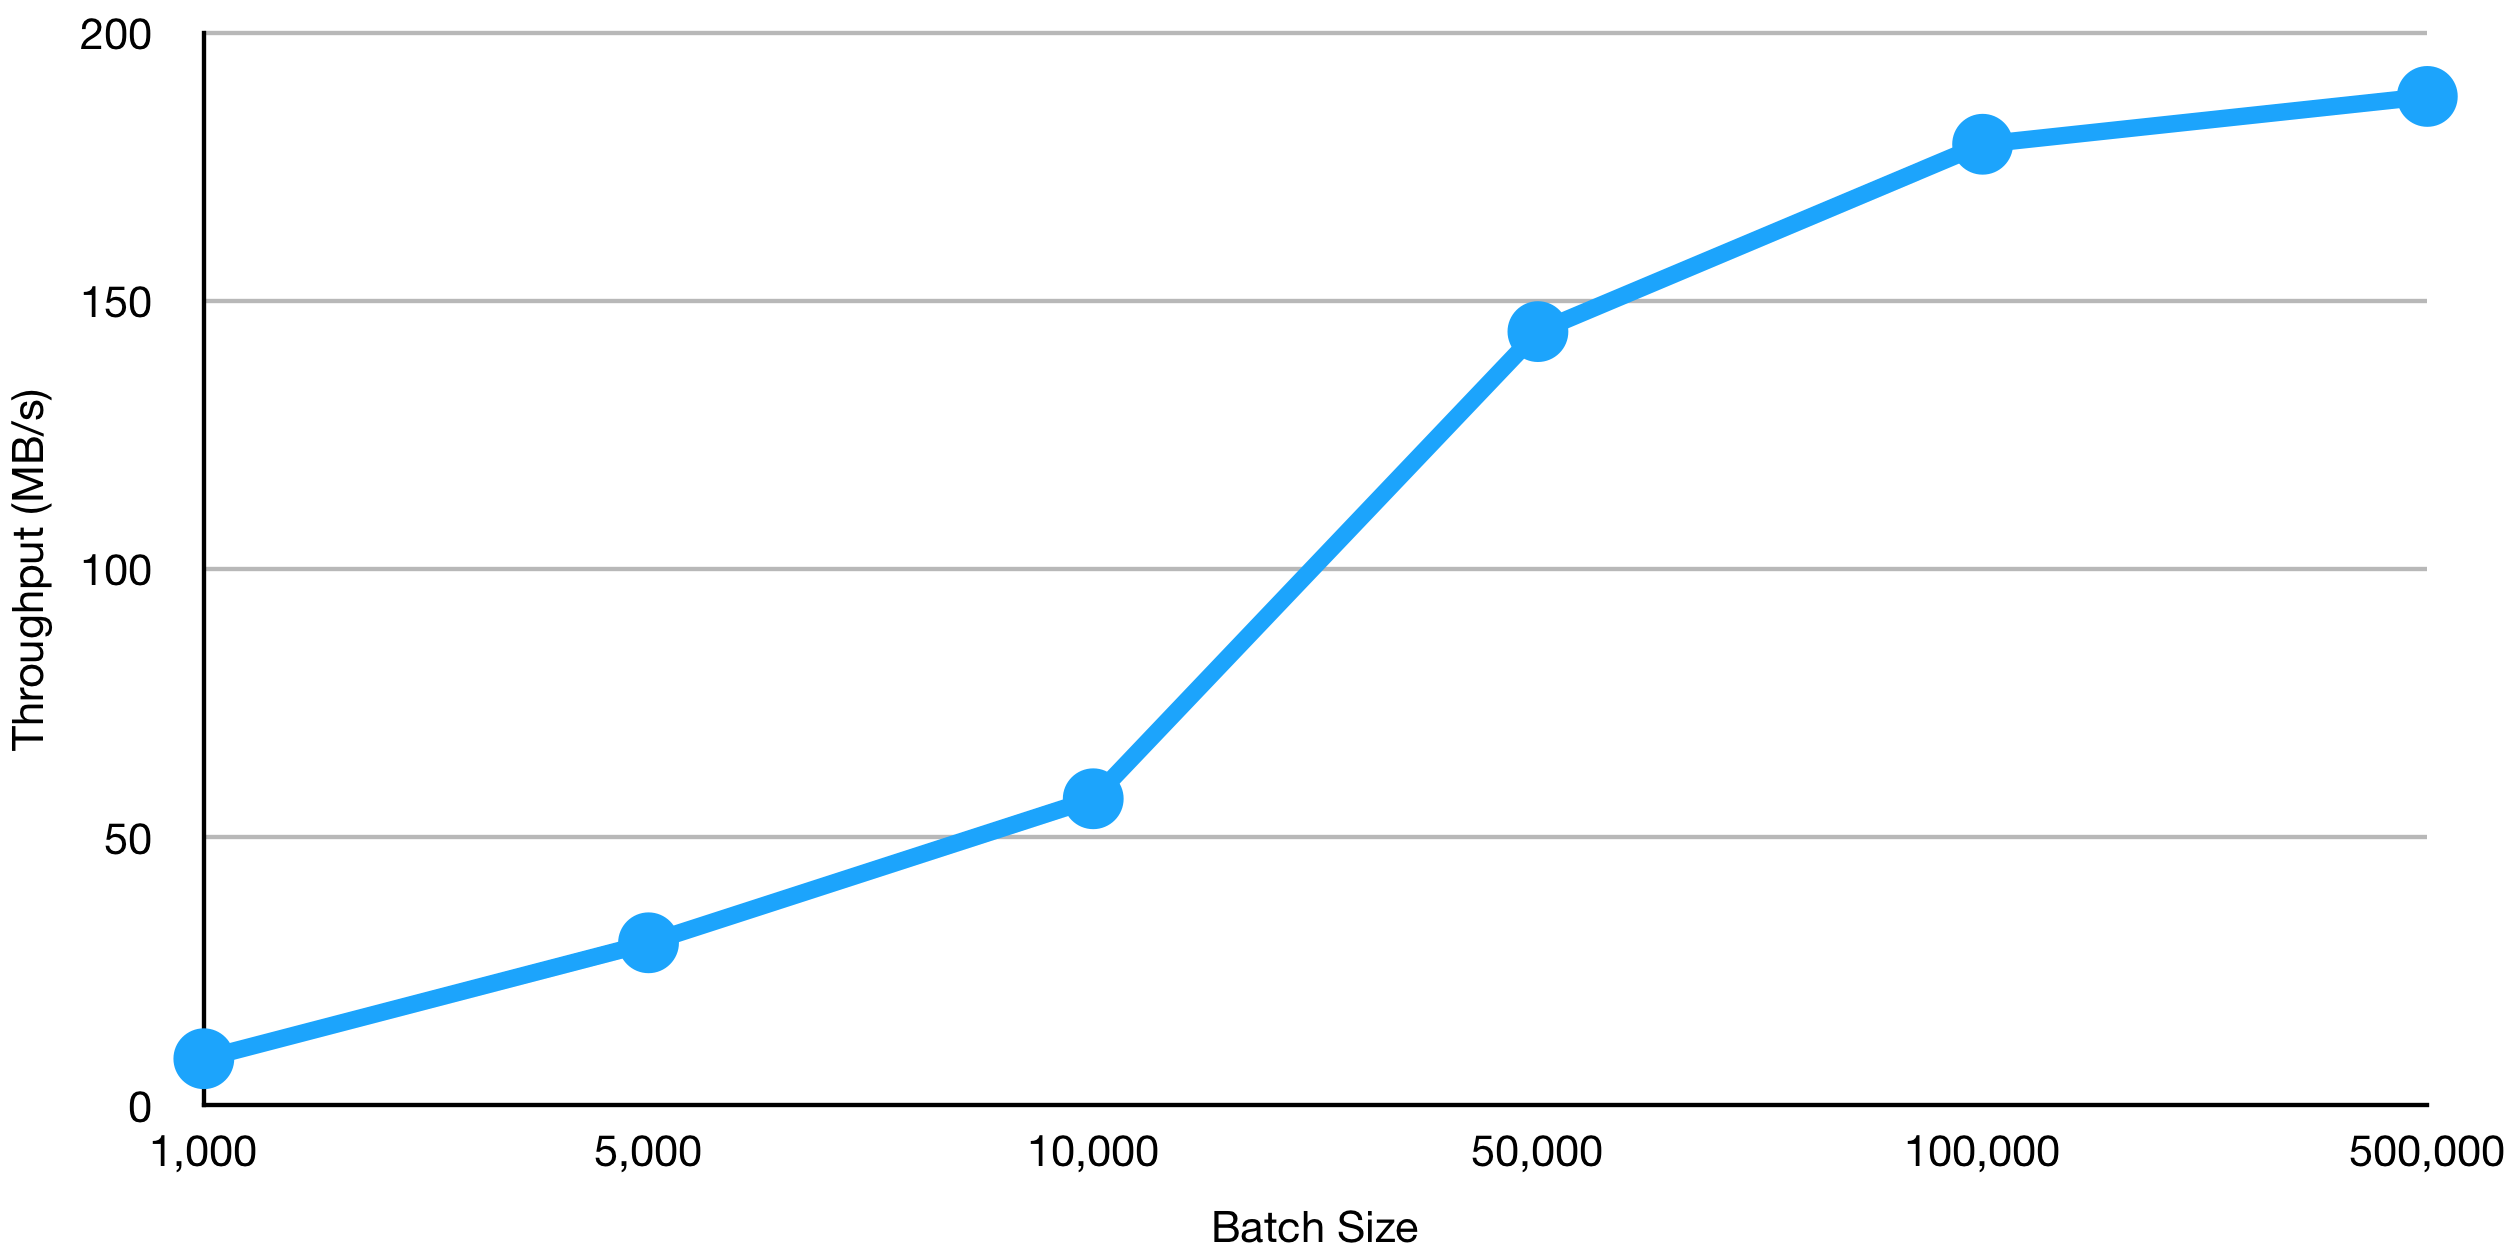
This configuration defines the maximum size of a batch in bytes. Increasing the batch size leads to higher throughput but may also increase latency as the producer waits to accumulate enough messages to fill the batch. You should experiment with different batch sizes to find the optimal balance between throughput and latency for your specific use case. The following diagram shows the relationship between batch size and throughput (source).
Compression
Enabling message compression reduces the amount of network bandwidth and storage required, leading to increased throughput.
compression.type
This configuration defines the compression algorithm used by the producer. Available options include "none", "gzip", "snappy" "lz4", and “zstd” While "none" disables compression, the other options provide different trade-offs between compression ratio and CPU usage. "None" is the default setting. You should choose a compression algorithm that best balances resource usage and bandwidth savings for your specific use case. The following diagram shows the relationship between compression type and throughput (source).
Acknowledgment
Acknowledgments required by the producer from the broker determines the durability of the messages.
acks
This configuration specifies the required number of acknowledgments from the broker that the producer must receive to consider a message as successfully sent. There are three possible values:
- 0: The producer does not wait for any acknowledgment. This setting provides the lowest latency and durability, as messages may be lost if a broker fails.
- 1: The producer waits for the leader broker to acknowledge the message. This setting balances latency and durability, ensuring that messages are written to at least one replica.
- 1 or all: The producer waits for all in-sync replicas to acknowledge the message. This setting provides the highest durability and latency, as the producer has to wait for all replicas to confirm the message.
The following diagram shows that acks are essential aspects of a data streaming system, ensuring reliable message acknowledgment, persistent data storage, and continuous service accessibility to maintain optimal system performance.
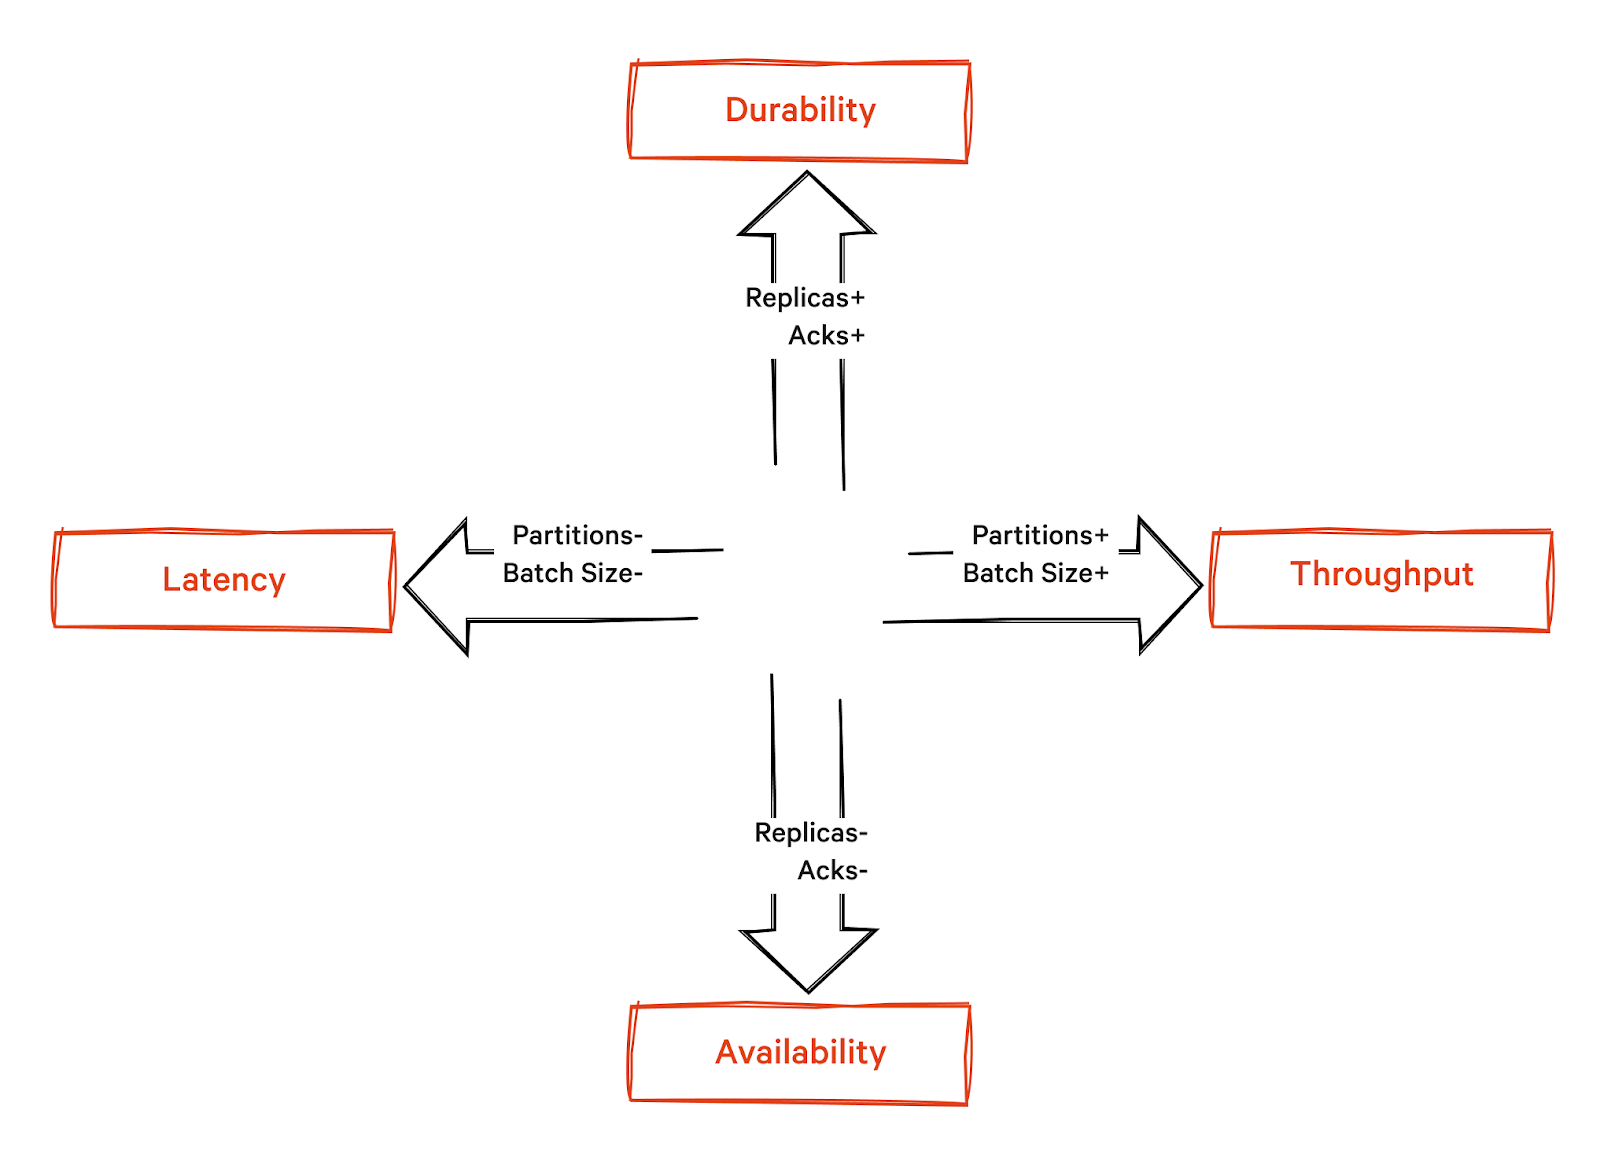
You should choose an acknowledgment level based on your application's requirements for data durability and tolerance for latency. For example, in banking/fintech transactions, we value durability over latency, whereas in anomaly detection and real-time analytics, we prioritize latency.
Max in-flight requests per connection
Controlling the number of unacknowledged requests Kafka sends before blocking further requests manages the trade-off between throughput and message reordering. Adjusting this parameter helps balance system performance and ensures proper message ordering.
max.in.flight.requests.per.connection
This configuration defines the maximum number of unacknowledged requests the producer sends on a single connection before blocking. Decreasing this value reduces the likelihood of message reordering in case of retries but may also limit throughput, as the producer has to wait for acknowledgments before sending more messages. You should set this value based on your application's tolerance for message reordering and desired throughput.
[CTA_MODULE]
Kafka performance tuning of consumers
Kafka consumers are responsible for consuming messages from the Kafka cluster. Optimizing them is crucial for achieving low latency and high throughput Kafka performance tuning. This section discusses critical configurations and strategies to fine-tune Kafka consumers.
Fetch size
The fetch size directly impacts the number of messages a consumer fetches from the broker in a single request. Configuring fetch size based on the expected message size optimizes throughput.
fetch.min.bytes
This configuration defines the minimum amount of data, in bytes, that the broker should return for a fetch request. Increasing this value leads to fewer fetch requests, reducing the overhead of network communication and I/O operations. However, it may also increase latency as the consumer waits for enough messages to accumulate before making a fetch request. You should experiment with different fetch sizes to find the ideal balance between throughput and latency for your specific use case.
Max poll records
Controlling the maximum number of records fetched in a single poll request helps balance the data streaming processing time and consumer lag.
max.poll.records
This configuration defines the maximum number of records a consumer fetches in a single poll. By adjusting this value, you control the trade-off between the time spent processing records in the application and the potential for consumer lag. A smaller value leads to more frequent polls and lower consumer lag but also increases the overhead of processing records. Conversely, a larger value improves throughput but results in higher consumer lag if the consumer cannot process records fast enough. You should set this value based on your application's processing capabilities/resources and tolerance for consumer lag.
Client-side buffering
You use buffering to reduce the impact of network latency on consumer processing.
fetch.max.bytes
This configuration defines the maximum amount of data, in bytes, that the consumer buffers from the broker before processing it. Increasing this value helps the consumer absorb temporary spikes in network latency, but it may also expand the memory footprint of the consumer. You should choose a buffer size that balances the trade-off between network latency and memory usage for your specific use case.
Consumer group rebalancing
Configuring session and heartbeat timeouts optimizes group rebalancing, ensuring consumer groups maintain a stable membership and quickly detect failed consumers.
session.timeout.ms
This configuration defines the maximum amount of time, in milliseconds, that a consumer can be idle without sending a heartbeat to the group coordinator. If no heartbeat is received within this time, the consumer is considered failed, and the group triggers a rebalance.
Rebalancing in Kafka can impact performance, as it may cause temporary disruption in message processing while consumer groups reassign partitions to ensure even distribution of workload across consumers. During this process, the overall throughput and latency may be affected, making it essential to monitor and manage rebalancing events carefully. You should set this value based on your application's processing capabilities and the desired frequency of rebalances.
heartbeat.interval.ms
This configuration defines the interval, in milliseconds, at which the consumer sends heartbeats to the group coordinator. A shorter interval helps the group coordinator detect failed consumers more quickly but also increases the coordinator’s load. You should choose a heartbeat interval that balances the trade-off between failure detection and coordinator load for your specific use case.
Monitoring and Alerting on Consumer Lag in Real Time
Consumer lag, the gap between when messages are produced and consumed, is one of the most important indicators of Kafka's health. Left unchecked, it can lead to delayed processing, stale data, and storage pressure on brokers. Use Kafka’s built-in metrics (like records-lag-max) alongside tools such as Prometheus, Grafana, or Datadog to monitor lag continuously and trigger alerts when it exceeds defined thresholds. Visualizing trends over time helps identify recurring bottlenecks, while proactive measures, like scaling out consumers, optimizing processing logic, and rebalancing partitions, ensure your pipelines stay fast, reliable, and real-time.
Operating system and hardware tuning
Optimizing the operating system and hardware configurations is essential for Kafka performance tuning. In this section, we discuss key factors to consider in terms of disk and file systems, network configuration, and memory and CPU allocation.
Storage hardware
Kafka heavily relies on disk I/O operations. Therefore, it's essential to use high-performance storage hardware, such as SSDs, to reduce latency and improve throughput. Using RAID configurations (e.g., RAID 10) increases storage redundancy and fault tolerance.
File system
Select a file system that provides decent performance and stability for Kafka. XFS and ext4 are widely recommended file systems for Kafka deployments. You can also consider tuning file system parameters, such as disabling access time updates and enabling write barriers.
Network hardware
Use high-performance network interfaces (e.g., 10 GbE or higher) to ensure sufficient bandwidth for Kafka's communication needs. In addition, ensure that network switches and routers are correctly configured and handle the expected traffic load.
OS network settings
Key configurations include increasing the maximum number of open file descriptors, tuning the TCP send/receive buffer sizes, and adjusting the maximum number of sockets in the TIME_WAIT state. In addition, monitoring network metrics (e.g., dropped packets, retransmissions) identifies bottlenecks and guides further optimizations.
Internal memory
Ensure that Kafka brokers have sufficient memory to handle the configured JVM heap size, OS page cache, and other processes running on the same machine. Monitor memory usage and garbage collection metrics.
CPU
Allocate sufficient CPU resources to handle Kafka's processing requirements, including message compression/decompression, replication, and log compaction. Monitor CPU usage and thread-level metrics.
Performance testing and benchmarking
Testing and benchmarking your Kafka performance tuning helps you:
- Identify performance bottlenecks and areas for improvement.
- Validate the impact of configuration changes on your Kafka cluster's performance.
- Ensure that your Kafka deployment can handle the expected message load and throughput requirements efficiently.
Tools and techniques
There are several tools and techniques available to test Kafka performance tuning such as:
- Kafka built-in tools like kafka-producer-perf-test.sh and kafka-consumer-perf-test.sh scripts.
- Third-party tools like Open-Messaging-Benchmark, Confluent's kafka-load-gen and LinkedIn's kafka-tools.
- Custom test clients are developed internally to simulate case-specific message patterns and processing requirements.
Throughout the performance testing and benchmarking process, monitoring your Kafka cluster using tools like JMX, Grafana, and Prometheus is essential.
Best practices
For testing your Kafka performance tuning you should:
- Test in an environment that closely resembles your production environment, including hardware, network conditions, and configurations.
- Use realistic message sizes and patterns to simulate your use case accurately.
- Start with a baseline configuration and gradually make changes, measuring the impact of each change on performance.
- Monitor the performance of your Kafka cluster continuously, both during testing and in production, to detect and address potential issues proactively.
[CTA_MODULE]
Conclusion
Kafka performance tuning is a crucial process to ensure that your Kafka deployment meets the requirements of your specific use case while providing optimal performance. You can achieve the desired balance between throughput, latency, and resource usage by carefully adjusting configurations related to Kafka producers, consumers, topics, operating systems, and hardware.
Remember that the ideal configuration varies depending on factors such as message size, network conditions, and hardware resources. It's crucial to continuously monitor and test your Kafka cluster to find the most suitable configuration for your needs. A successful Kafka performance tuning process involves a thorough understanding of the various configurations, careful monitoring and benchmarking, and iterative adjustments based on your specific use case.
[CTA_MODULE]