

Kafka tools—a deep dive


Kafka tools
Kafka tools are specialized utilities and applications designed to simplify Apache Kafka® clusters' management, monitoring, and optimization. Managing Kafka clusters can become very complex as the system scales.
Kafka tools simplify and automate administrative tasks that were otherwise very repetitive, such as monitoring the cluster's key metrics and improving its scalability. In addition to cluster management, Kafka tools simplify monitoring and security configurations and allow administrators to define fine-grained access policies.
Kafka tools enhance overall functionalities, enabling organizations to leverage real-time data streams with reduced operational complexity. Their user-friendly interfaces make it easier and more enjoyable for even beginners to handle Kafka.
This chapter explores the various Kafka tools, highlighting their significance, must-have features, and ways they simplify administrative tasks. It also discusses future trends in Kafka tooling.
Summary of key Kafka tools
| Concept | Description |
|---|---|
| Kafka tools | Specialized utilities and applications for simplifying management, monitoring, and optimization of Kafka clusters. |
| Command-line interface tools | Terminal-based tools for performing administrative tasks and operations on Kafka clusters. |
| Web-based user interface tools | Browser-based graphical tools for managing Kafka clusters, designed for users with limited CLI knowledge. |
| Monitoring tools | Track the performance and health of Kafka clusters. They provide visualization of the most important metrics and generate alerts. |
| Replication tools | Replicate data between Kafka clusters to ensure high availability. |
In the following sections, we explain these tools with specific examples and tutorials.
1. CLI tools
Kafka distribution includes several CLI tools. Additionally, some third-party tools can also be used from the command line and the browser.
Kafka CLI tools
The Kafka distribution comes with various command-line interface (CLI) tools to interact with Kafka clusters through terminal commands. These tools offer a range of administrative capabilities and operational tasks. We give a list below.
| Command | Description |
|---|---|
kafka-topics.sh | Manages Kafka topics (creation, deletion, listing) |
kafka-console-producer.sh | Produces messages to a Kafka topic from the command line |
kafka-console-consumer.sh | Consumes messages from a Kafka topic from the command line |
kafka-configs.sh | Alters and describes topic configurations |
kafka-acls.sh | Manages access control lists (ACLs) for Kafka topics |
Now, let’s explore the first two commands and their detailed implementation.
Kafka topic command tutorial
The kafka-topic.sh command allows you to perform various operations on Kafka topics, including creation, deletion, listing, and describing topics. Some prerequisites for using this tool.
- Obtain Kafka binaries from the Kafka website and extract them.
- Use the CLI to start Kafka broker services
- Ensure Kafka configuration files (e.g., server.properties) are properly set.
- Open all the necessary ports for network accessibility.
You can create a topic as follows:
--topic: Specifies the name of the topic to be created.--bootstrap-server: Indicates the Kafka broker's address.--partitions: Defines the number of partitions for the topic. You can have as many partitions as you like!--replication-factor: Sets the replication factor, determining how many brokers will replicate each partition, which means your replication factor can never exceed the number of brokers you have!
You can also list topics to identify all the existing topics within a Kafka cluster.
You can request a “describe” to receive detailed information, including partitions, replication factors, and other topic configurations. For each partition, you can also get detailed metadata for the specified topic, such as the leader, replicas, and in-sync replicas (ISR). For example, to inspect details about our topic, you would execute the following command:
kafka-topics.sh --describe --bookings-events --bootstrap-server localhost:9092
Upon executing the command, you would typically see output similar to the following:
This output provides crucial details about the booking-events topic, including partition count, replication factor, leader brokers for each partition, and the in-sync replicas (ISR). Such insights are invaluable for Kafka administrators and developers responsible for performance optimization, ensuring fault tolerance, and scaling Kafka topics effectively within distributed systems.
If you want to free up resources, you can delete a topic with the following command:
For the above command to work, you must enable topic deletion in the Kafka broker configuration (delete.topic.enable=true).
You can also alter the configurations of an existing topic, such as changing the number of partitions, as given below.
Kafka console producer command tutorial
The kafka-console-producer.sh allows you to manually publish messages to a Kafka topic directly from the terminal or command prompt. You can test, debug, and send data to Kafka clusters without writing custom-producer applications. Here's an example of how to send a message to a Kafka topic:
The kafka-console-producer.sh initializes a producer connected to the Kafka cluster on localhost:9092. After executing the command, you can type your message directly into the terminal. Each line you enter is treated as a separate message and sent to the Kafka topic my-topic.
kcat
kcat is a third-party, open-source powerful tool famous for its ability to produce and consume messages from Kafka topics directly from the terminal. It is similar to the kafka-console-producer and kafka-console-consumer but has even more features. You can produce messages with kcat to a Kafka topic with a command like this:
This command sends the message "Hello, Kafka!" to the topic my-topic running on the Kafka broker located at localhost:9092.
- P indicates that it's a producer command; we will be using -C to consume messages.
- B specifies the bootstrap server address, which is localhost:9092 in this example.
- t specifies the topic name, which is
my-topicin this example
Its simple design and strong community make it a popular choice for developers and administrators alike. It is most commonly used for debugging, testing, and operational tasks.
2. Web-based user interface tools
These tools allow users to configure, monitor, and manage Kafka using intuitive and interactive interfaces. They offer more convenience and are beginner-friendly.
CMAK
CMAK (previously known as Kafka Manager) is a tool for managing Kafka clusters. It can manage multiple clusters and inspect their state, including factors like topics, consumers, offsets, and brokers. It can also automate and adjust configurations and manage consumer groups. This open-source UI tool is customizable and easily integrated with other Kafka environments.
One limitation of Kafka Manager is its interface, which, while functional, can be considered less intuitive and visually dated compared to newer tools like Redpanda Console. The interface of Kafka Manager may lack advanced visualizations and interactive features that provide deeper insights into Kafka cluster metrics and performance.
Redpanda Console
Redpanda Console is a unified interface for managing the entire Kafka ecosystem, including brokers, topics, consumers, connectors, and user access management.

Redpanda Console offers:
- Modern and user-friendly interface that is easy to navigate and understand and has better visualization capabilities.
- Detailed real-time monitoring capabilities for Kafka clusters that enable administrators to track metrics and performance effectively.
- Simplified creation, configuration, and monitoring of topics, facilitating streamlined data organization.
Redpanda Console supports scalable Kafka deployments and includes features for optimizing performance, ensuring reliable handling of large data volumes. It integrates well with various tools and platforms, offering flexibility for customization to meet varying operational requirements.
Topic creation with Redpanda Console
Before creating a topic in Redpanda Console, ensure the following prerequisites are met:
- You have to make sure you have a running Kafka cluster.
- You must have the necessary permissions to create topics in the Redpanda Console.
- You must verify that your network settings allow you to access the Redpanda Console. You can check the necessary configurations of the console in this documentation.
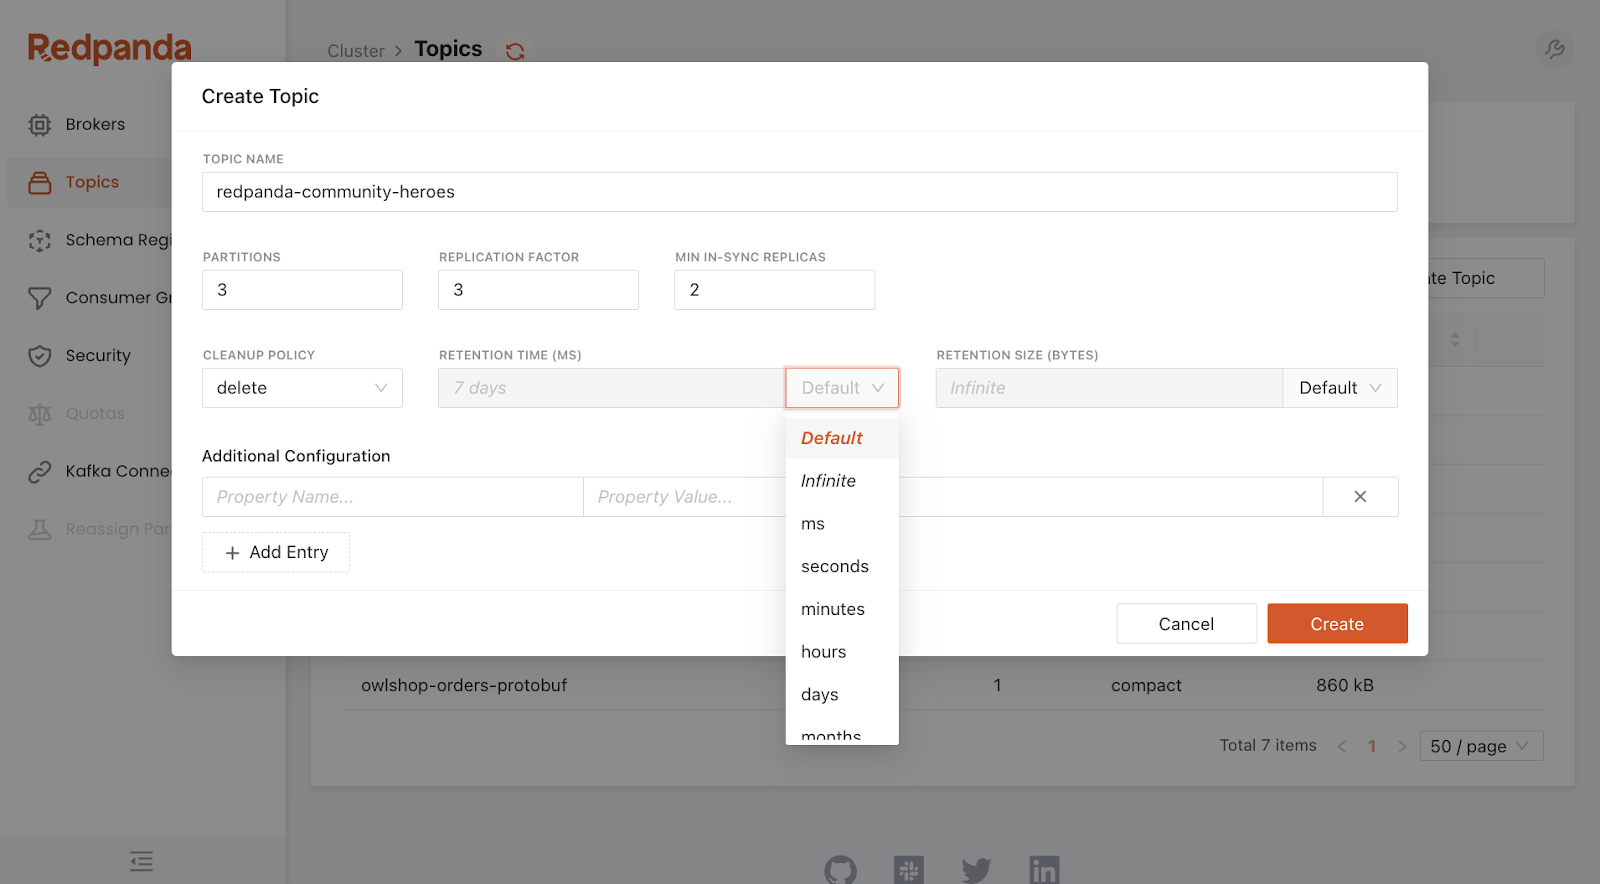
Log in to Redpanda Console through your web browser. Once logged in, find the sidebar menu and navigate to the "Topics" section.
- Click the "Create Topic" button to open the topic configuration form.
- Enter a unique name for your topic, specify the number of partitions, and set the replication factor.
- You can also choose a cleanup policy as either “delete” or “compact” to manage log retention effectively
- Click the "Create Topic" button, and your topic will be successfully created!
You can have an in-depth look into the Redpanda console here.
3. Monitoring tools
Monitoring tools track the performance and health of Kafka clusters. They provide visualization of the most important metrics and generate alerts. Key Kafka metrics to monitor include:
- Broker metrics like throughput, error rates, I/O utilization, and memory usage.
- Topic metrics like Message production/consumption rates, log size, and partition status.
- Consumer metrics: Consumer lag, offset commit rates, consumer group health.
- ZooKeeper metrics: Connection counts, request latency, session expiration.
Several types of tools are available to monitor Kafka applications, including open-source tools, proprietary tools, and purpose-built tools. Each type has its own advantages; you can choose your option based on the availability of resources and organizational priority.
Prometheus with Grafana
Prometheus is an open-source system monitoring and alerting toolkit for collecting and querying metrics. It is widely used for its multidimensional data model, flexible query language, and efficient time series database. Metrics have distinct labels, making queries even more powerful and helping in aggregation. Rule-based alerting system generates notifications directly to different channels, including Slack, email, and PagerDuty.
Grafana is an open-source platform that can integrate with various data sources, including Prometheus. It provides rich visualization capabilities that allow users to create custom, dynamic dashboards for Kafka metrics. Grafana also allows alert rules to be set that can trigger notifications based on metrics threshold.
Using Prometheus and Grafana
You can set up Prometheus to collect metrics from Kafka brokers, Zookeeper, Kafka Streams, and Kafka Connect through exporters. The kafka_exporter module plays a key role here.
You must install and configure both Prometheus and the kafka-exporter then add the kafka-exporter target in the Prometheus configuration. Next, install and configure Grafana. Add Prometheus as a data source in Grafana.
Now you can import pre-built Kafka dashboards or create custom dashboards. You can also define Prometheus alert rules and configure Grafana alerts for visual thresholds and notifications.
Other tools
Datadog is a third-party cloud-based monitoring and analytics platform that integrates with Kafka to provide real-time monitoring, log management, and alerting. It includes detailed dashboards for monitoring broker performance, topic metrics, and consumer group health.
New Relic is an observability platform that offers Kafka monitoring through integrations. It provides insights into Kafka performance, allowing error tracking and anomaly with customized dashboards and visualization.
Discover more tools and in-depth tutorials in our Kafka monitoring tools guide.
4. Replication tools
Replication tools help in data replication across Kafka clusters, thereby playing an important role in high availability and data consistency across the network.
Kafka MirrorMaker
Kafka MirrorMaker is an open-source tool for replicating data between clusters. It is included in the Kafka distribution. It consumes messages from topics in a source Kafka cluster and produces them in topics in a target Kafka cluster.
This is important for use cases such as disaster recovery, which helps retrieve lost data. MirrorMaker can handle large-scale replication tasks, though manual tuning and monitoring are required to ensure optimal performance. Tutorials and best practices for MirrorMaker2 can be found in our in-depth guide.
uReplicator
uReplicator is a well-known alternative developed by LinkedIn to address some of the limitations of Kafka MirrorMaker. It has advanced failover mechanisms and better monitoring capabilities. With large-scale Kafka deployment that requires high availability and consistent performance, uReplicator is your best choice.
Other replication tools exist, such as Strimzi for Kubernetes-native Kafka replication and Databus by Linkedin.
How Kafka tools help
Kafka tools support Kafka deployment in multiple ways. While one tool may not help with everything, many provide overlapping functionality.
Cluster management
Administrators can find scaling a Kafka cluster challenging when there are varying demands. Some Kafka tools make it easier to dynamically adjust resources to meet those demands. Automated scaling allows the addition of brokers and partitions without any major downtime or deadlocks. These tools even predict the need for scalability by offering real-time monitoring and alerting systems.
These Kafka tools also allow creating and managing partitions for existing topics, enabling better load distribution and scaling. As new brokers are added, these tools can automate the process of rebalancing partitions, ensuring a smooth scaling process.
Performance monitoring
Performance monitoring is critical to ensuring the health of Kafka clusters. Some Kafka tools allow real-time monitoring of critical metrics such as throughput, latency, consumer lag, and broker health. In case of any anomaly, they produce performance degradation alerts using timely alerting systems. Moreover, these monitoring tools also allow historical data analysis to identify when an issue may occur.
Configuration management
Configuration management allows centralized control and versioning of Kafka cluster settings. This is usually accomplished by a single interface allowing administrators to apply these configurations across all brokers, topics, and consumer groups. You can ensure consistency and reduce the risk of errors. Moreover, template-based configurations and standardized settings further improve consistency. Most of these tools also have version control features, allowing changes to be tracked and reverted to previous configurations.
Topic management
Kafka tools provide commands to handle all aspects of the topic lifecycle. They offer intuitive interfaces that allow administrators to create, modify, and delete topics or adjust the number of partitions and replication factors to meet changing requirements. The tools also provide in-depth details of topic configurations and usage metrics, thereby helping optimize resource allocation and performance.
Consumer group monitoring
Various Kafka tools provide detailed insights into consumer group activity and performance. They can list all the consumer groups and their current offsets, so you can ensure that messages are processed on time. Administrators gain visibility into which topic the consumer groups are subscribed to and the status of each partition within the group so that they can make informed decisions.
Security and access control
Administrators can easily configure user authentication mechanisms such as SASL (Simple Authentication and Security Layer) or SSL/TLS (Secure Sockets Layer/Transport Layer Security) to authenticate clients connecting to the cluster.
Tools also enable role-based access control (RBAC), allowing administrators to define fine-grained access policies for users and applications based on roles and permissions. You can encrypt the data, ensuring the confidentiality of sensitive information and minimizing unauthorized access and data breaches.
Emerging trends in Kafka tooling
Various Kafka tools have been developed with enhanced capabilities, and more tools are continually being developed to incorporate newer trends.
Machine learning and AI integration
Integration of Kafka tools with machine learning and Artificial intelligence (AI) frameworks is on the rise. This incorporates predictive maintenance in an already fast environment. Monitoring and visualization tools can also be enhanced with ML as they generate faster monitoring reports based on trained data models. This integration accelerates insights and improves operational monitoring in fast-based environments.
Adoption of serverless architecture
Kafka tools are being increasingly adopted within serverless architectures and platforms like AWS Lambda and Azure Functions. These platforms integrate Kafka tools to enhance event-driven processing without infrastructure overhead.
For example, Airbnb utilizes AWS Lambda and Kafka to design its event-driven architecture for real-time booking updates and user notifications. When a booking is made, an event is triggered that gets published on the Kafka topic. Moreover, AWS Lambda functions are triggered to handle the subsequent tasks. The tasks include updating the booking status, generating notifications for hosts and guests, and logging transactions for analytics. This serverless allows Airbnb to scale easily without worrying about traffic spikes and costs.
Integration with Kubernetes
Kafka tools are increasingly integrated with Kubernetes (K8s) for containerized deployment, management, and scaling. This enables proper resource utilization in cloud-native environments
For example, the New York Times uses Kafka integrated with Kubernetes for its state-of-the-art content management and distribution system. This helps the company to ensure efficient processing and delivery of news articles and multimedia content.
Moreover, K8s coordinate the Kafka brokers so they can be properly used and scaled. This is essential for managing the high volume of real-time data required to keep readers updated with the latest news.
Conclusion
Kafka tools are known for their reliability and extensive ecosystem support, yet they often require significant operational expertise and infrastructure management. Kafka is more than a decade-old solution, and while robust, it fails to meet the needs of many modern use cases.
The biggest challenge is to maintain configurations at scale without compromising cost and performance. Over time, Kafka gets more complex and expensive to maintain, no matter what deployment and tooling you use.
Redpanda is a fully Kafka-compatible, high-performing, and easier-to-manage alternative. It comes with its own CLI tool—the Redpanda CLI (rpk)—designed for managing the entire Redpanda cluster without the need to run a separate script for each function, like with the Kafka CLI. It can handle low-level tuning to high-level general Redpanda tasks.
For example, you can carry out simple tasks like creating topics or slightly more demanding tasks such as rolling upgrades and monitoring cluster health.
To learn more about rpk and what it can do, check out this blog on how to get started with rpk: Redpanda’s dev-friendly CLI.